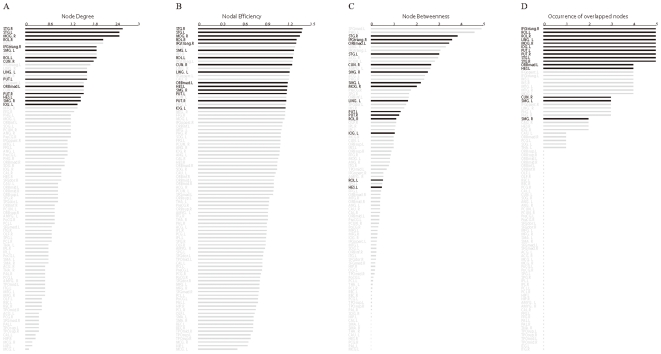
Figure 6. The regional nodal properties of overlapped nodes in the structural brain network.
The bar plot of all 90 regions is listed in descending order of their (A) node degree, (B) nodal efficiency, and (C) node betweenness, respectively. (D) The occurrence of overlapped nodes in the structural brain networks constructed at all selected cost thresholds (cost = 0.13, 0.15, 0.18, 0.20, 0.22); the overlapping community structure of all brain networks was detected using the same parameter (k = 7). Regions with a high occurrence were determined to be insensitive to the selection of cost thresholds. The black and gray bars indicate overlapped nodes and non-overlapped nodes, respectively. For a description of the abbreviations, see supplementary Table S1.

