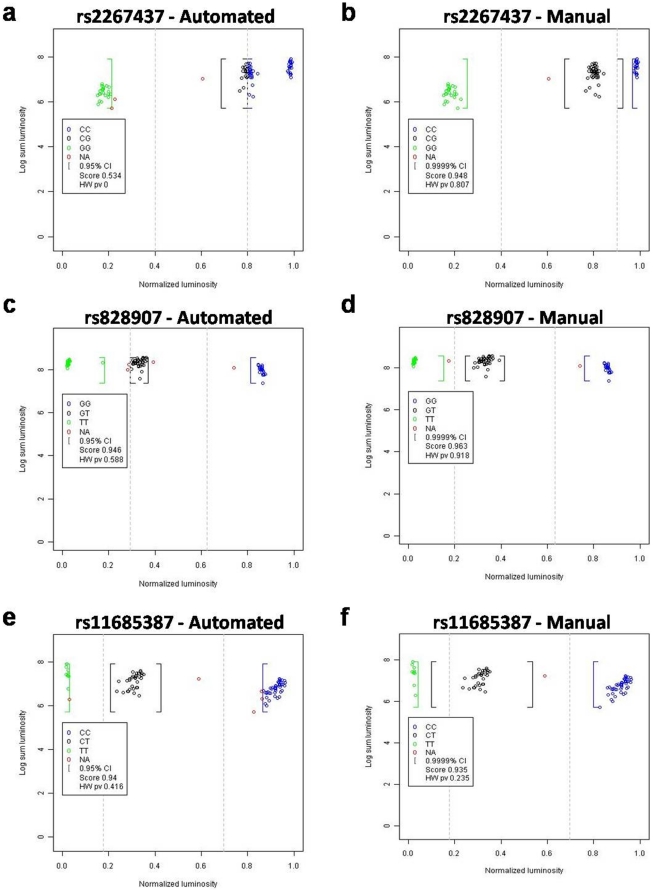
Figure 3. Manual versus automated genotype calls.
An example of manual versus automated genotype calls obtained from the same assay is provided for SNP rs2267437 (a and b), rs828907 (c and d) and rs11685387 (e and f). The X axis represents the normalized intensity ϕ, whereas the Y axis value represents the logarithm of the sum, of the mean intensity of both probes. Automated calls (a, c and e) were obtained using the default parameters of ALG: confidence α = 0.05; minimum luminescent threshold = 300 and default cut-off definition method. These parameters yield cut-off values of 0.8/0.4, 0.6/0.3 and 0.7/0.2 respectively for rs2267437, rs828907 and rs11685387. Manual calls (b, d and f) were obtained with the following user-defined parameters: confidence α = 0.0001; minimum luminescent threshold = 300; default cut-off definition method. These parameters yield cut-off values of 0.6/0.3 and 0.7/0.2 respectively for rs828907 and rs11685387. Cut-off values for the SNP rs2267437 were set to 0.9/0.4 after visual inspection of the results.

