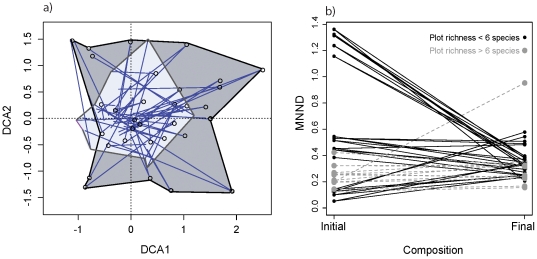
Figure 2. Detrended Correspondence Analysis of initial (dark grey) versus final (light grey) community compositional space (grey envelopes delineate outer envelope of starting composition of plots) (a).
Circles are initial plots and lines end at final composition. Plot shows some compositional convergence, but substantial variation among plots remains. Convergence of mean nearest neighbor distances (MNND) (b), where diverse plots (i.e., with 8 or more more species—grey dashed lines) maintain MNND patterns despite species extinctions and species-poor plots (black solid lines) converge to high diversity MNND values.

