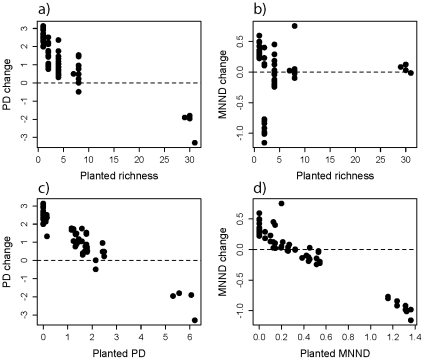
Figure 3. The relationship between planted diversity and diversity change in the experimental plots.
Plot PD generally declined with the number of species planted (a); there was substantial change in MNND for the low diversity plots, but little change in mean MNND (b); and there appeared to be a linear relationship between planted PD and PD change (c), and between planted MNND and MNND change (d).

