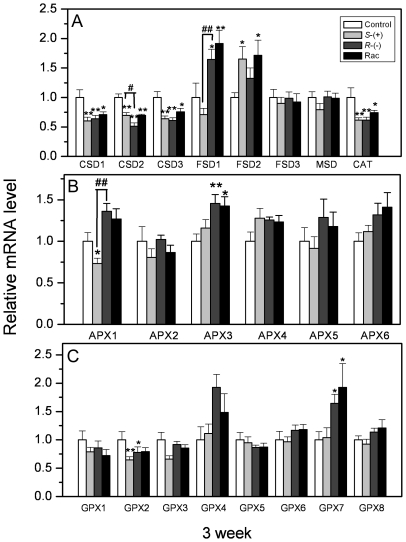
Figure 9. The gene expression of antioxidant enzyme in A. thaliana after 3 weeks of IM exposure.
A. Gene expression of superoxide dismutase (SOD) and catalase (CAT); B. Gene expression of ascorbate peroxidase (APX); C. Gene expression of glutathione peroxidase (GPX). Values were normalized against actin 2 as housekeeping gene, and represent relative mean mRNA expression value ±SEM of 3 individuals. * or ** represents a statistically significant difference when compared to that of the control (p<0.05 or 0.01, respectively). # or ## represents a statistically significant difference when compared to S-IM-exposed plants (p<0.05 or 0.01, respectively).

