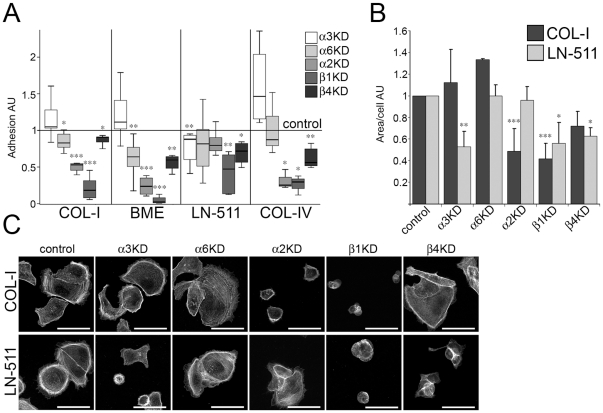
Figure 1. Adhesive properties of the integrin-depleted MDCK cells.
A) Single cell suspensions of control, Itgα3-, Itgα6-, Itgα2-, Itgβ1- and Itgβ4-KD MDCK cells were allowed to settle for 90 minutes on collagen I (COL-I)-, basement membrane-extract (BME)-, laminin-511 (LN-511)- or collagen IV (COL-IV)-coated tissue culture wells. Non-adherent cells were washed away and remaining adherent cells were fixed, stained and quantified. Adhesion of control cells to each coating was set to 1 and adhesion of the different Itg-KD cells is shown relative to control (arbitrary units, AU). Each Itg-KD sample represents data from 3–10 independent experiments and each value is normalized to a control value within the experiment. The spread of normalized values from the lowest to the highest, together with the 25th, 50th (median) and 75th percentiles is shown. P-values <0.05 are signified by (*), <0.01 by (**) and ≤0.001 by (***). B) Control, Itgα3-, Itgα6-, Itgα2-, Itgβ1- and Itgβ4-KD MDCK cells were plated on COL-I or LN-511-coated glass coverslips and allowed to spread for 90 minutes. Cells were fixed and filamentous actin was stained using TRITC-Phalloidin. C) Quantitation of the cell spreading data on collagen I (upper panel) and on LN-511 (lower panel). The combined data shows the mean +SD of 2–6 independent experiments. For each experiment and coating condition, ∼81–250 cells from 11 pictures were analyzed per one sample. Data is shown as KD/control ratio (Arbitrary units, AU) of the spreading area per cell due to significant variation between coating efficiencies in separate experiments. P-values <0.05 are signified by (*), <0.01 by (**) and P-values ≤0.001 by (***).

