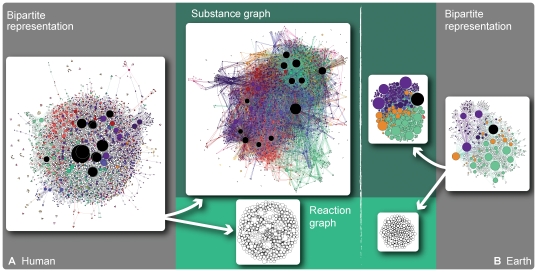
Figure 2. Ridiculograms of the human metabolism and Earth's atmospheric reaction system in bipartite, substance and reaction graph representations.
The areas of the vertices are proportional to their degree. White vertices are reaction vertices; black vertices are currency vertices. For the other vertices the color represent different network modules. The colors of the edges are the same as their vertex of largest degree.

