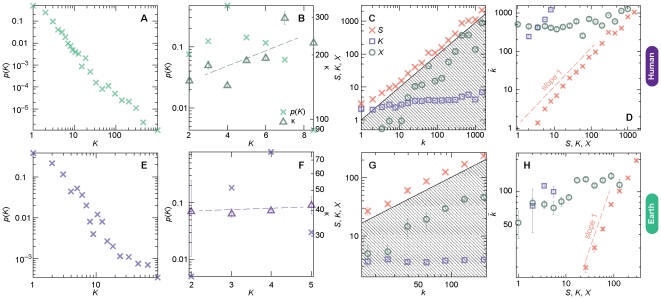
Figure 3. Deeper investigations of the degree distributions.
Panel A displays the degree distribution of substances in a bipartite representation of the reaction system, i.e. the probability distribution of the number of reactions a substance participates in. Panel B shows the corresponding plot for reactions and also the average degree of neighbors. The dashed line is a linear-regression line to highlight the trend in κ. C and G displays the values of the three bipartite-network terms of k—S (the sum of the degrees of neighbors), K (the degree) and X (the number of four-cycles the vertex participates in). The diagonal line shows the k-value (so if you subtract the values of circles and squares from the values of crosses you would get this line). Panel D and H shows the average degrees  of nodes with certain values of the three terms that contribute to the degree in the projected reaction networks.
  is averaged over logarithmic bins of S, K, and X values. The dashed line is a reference corresponding to a linear
  -dependence. Panels A–D are for the human metabolic reaction networks, E–H show the corresponding plots for the Earth atmospheric reaction networks.

