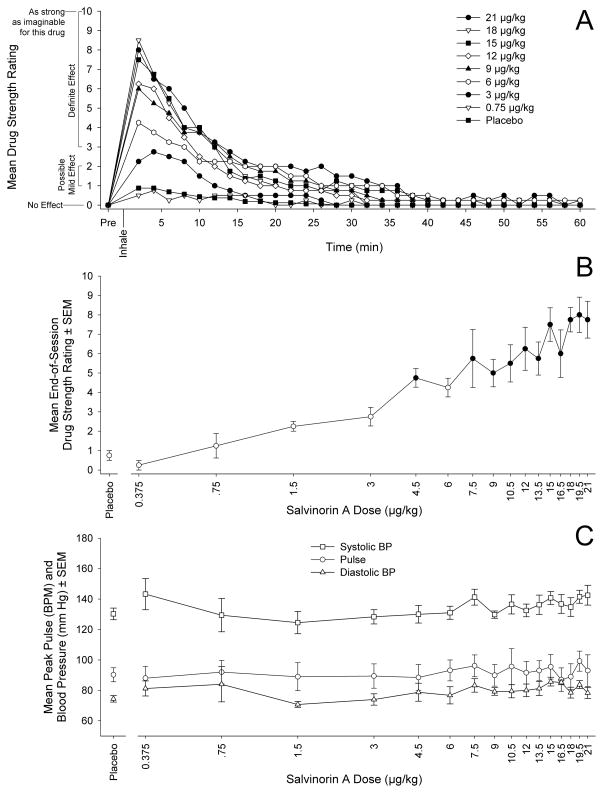
Figure 1. Time- and dose-related changes in drug effects.
(A) Subject-rated drug strength (reported at 2-minute intervals) as a function of time (pre-drug baseline to 60 minutes following inhalation). Data points show mean ratings (N=4). For graphical clarity, alternating doses in the dose sequence were deleted.
(B) Subject-rated peak drug strength from the end-of-session ratings as a function of dose (logarithmic abscissa). Data points show mean ratings (N=4); brackets show + and −1 SEM. Filled symbols indicate that the data point was significantly different from placebo (Tukey’s HSD test, p<.05).
(C) Peak heart rate (beats per minute) and blood pressure (mm of Hg) as a function of dose (logarithmic abscissa). Data points show means (N=4); brackets show + and − 1 SEM.

