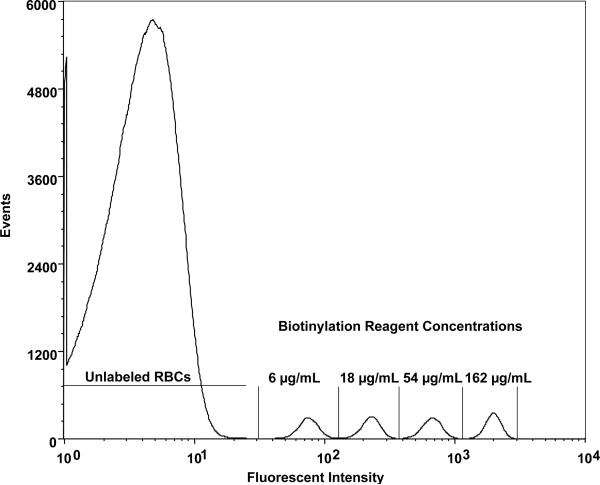
Fig. 1.
Flow cytometry histogram (Subject 1, Day 3 of survival) relating number of RBCs enumerated to log of fluorescent intensity for four populations of biotinylated human RBCs demonstrates the complete separation observed between each biotinylated RBC population and from the unlabeled RBC peak. “6, 18, 54, and 162 μg/mL” denote the populations of biotinylated RBCs produced by successive three-fold incremental increased of the biotinylation reagent, sulfo-succinimido-biotin.

