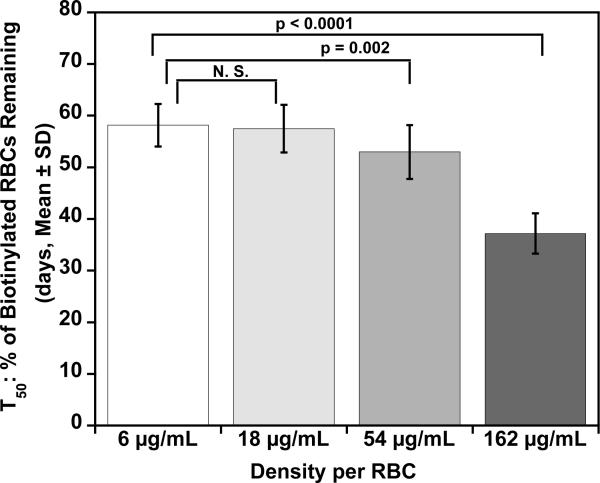
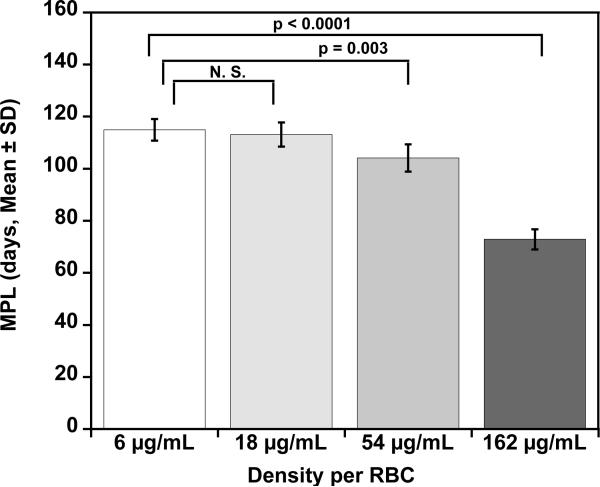
Fig. 4.
Mean T50 and MPL for each density of BioRBCs. Mean T50 values (A) for the four populations of autologous BioRBCs agree for the two lowest densities but are progressively shorter for the two highest densities. Mean MPL values (B) for the four populations of autologous BioRBCs agree for the two lowest densities but are progressively shorter for the two highest densities.


