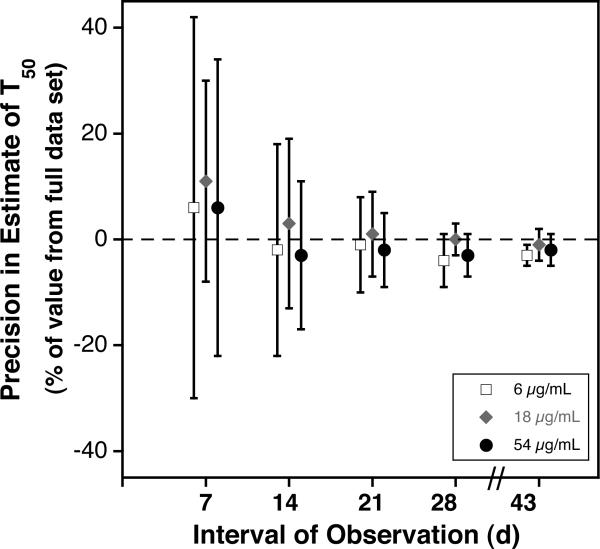
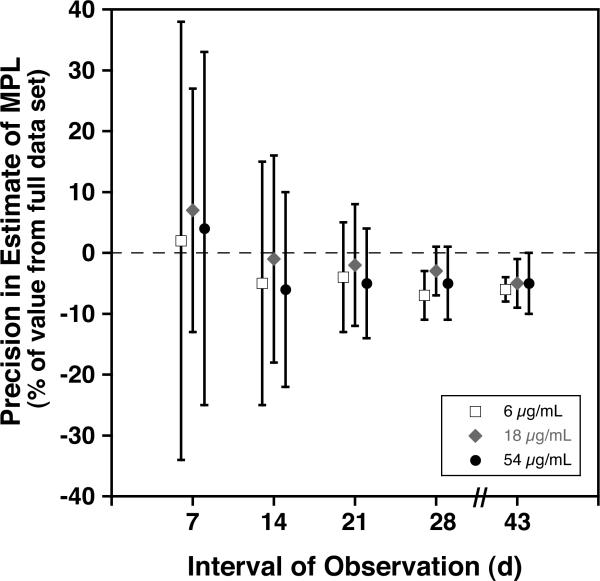
Fig. 5.
Effect of Length of Observation on Precision of Estimates of Long-Term RCS. For each the three lowest densities of autologous BioRBCs, mean ± 1 standard deviation of the difference in T50 (A) and in MPL (B) from the value obtained from the full data set is plotted against the interval of observation.


