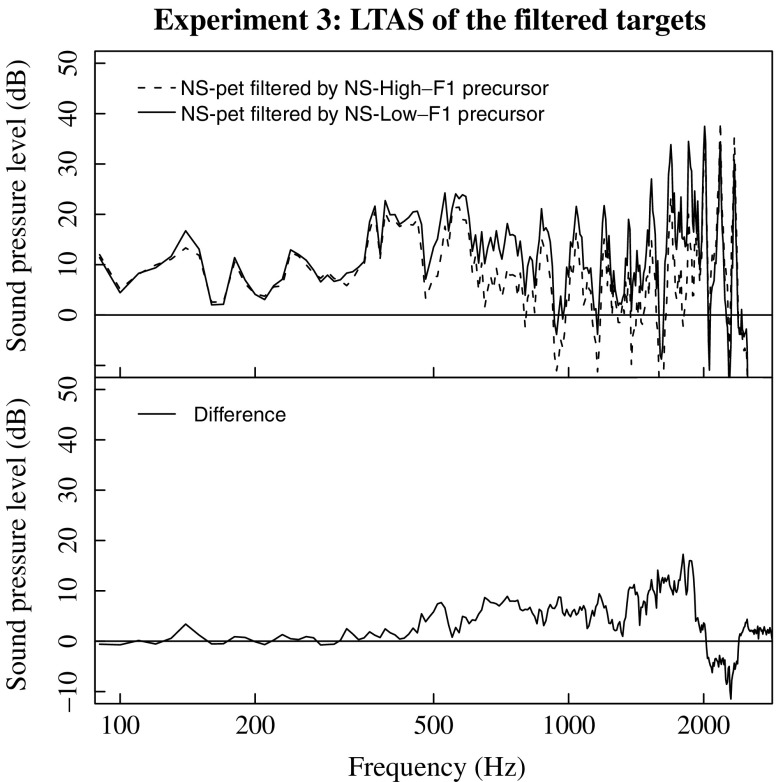
Fig. 7.
Upper panel: Long-term average spectrum (LTAS) plots for the endpoint “nonspeech /pɛt/” targets taken from Experiment 2, attenuated by a filter that was constructed from the low-F1 precursor (solid line) and the high-F1 precursor (dotted line) taken from Experiment 2. Bottom panel: The difference spectrum for the resulting two Experiment 3 sounds. Whereas, for the other figures, the difference spectrum were calculated by subtracting the low-F1 variant from the high-F1 variant, here the subtraction was made in the opposite direction for ease of comparison

