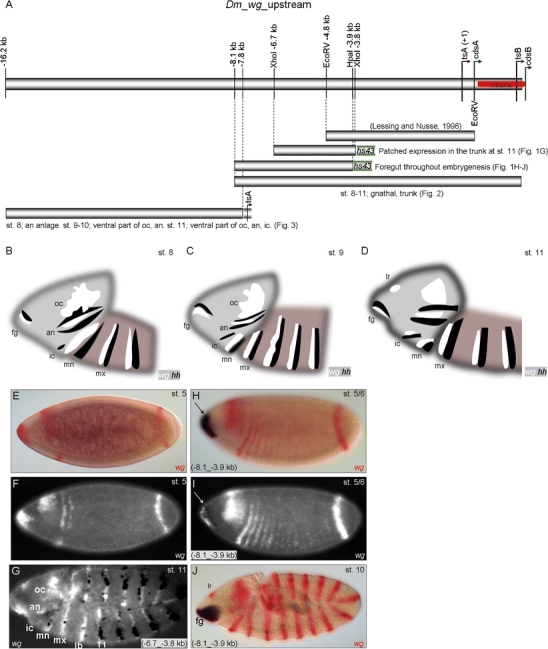
Fig. 1.

Functional dissection of the wg upstream region. a Schematic representation of partial wg locus and the fragments assayed for enhancer function in vivo. Bars represent the −4.8-kb fragment assayed by Lessing and Nusse (1998), the (−6.7_−3.8-kb) and (−8.1_−3.9-kb) fragments assayed in combination with hs43 basal promoter, the 10.216-kb fragment (spanning 8,094 bp upstream of tsA to +195 bp downstream of tsB), and the 8.4-kb fragment (−16.2_7.8 kb) assayed in combination with the endogenous tsA promoter (−159_+121 bp). b–d Schematic representation of wg (white) and hh (black) expression at different embryonic stages. e–j Double in situ hybridization of wg (FastRed staining or white fluorescent in f, g, i) and the mediated reporter gene expression (NBT/BCIP-blue staining or black in g, i). e, f Endogenous blastodermal wg expression. g Fragment (−6.7_−3.8 kb) mediates expression in cells of the trunk segments, excluding the gnathal segments (mn, mx, lb) at stage 11. h, i Fragment (−8.1_−3.9 kb) mediates expression in the anterior-most terminal region at blastodermal stages overlapping the endogenous wg expression. j During germ band extension, the same enhancer fragment mediates expression in the foregut anlage (fg). oc ocular, an antennal, ic intercalary, mn mandibular, mx maxillary, lb labial, lr labrum
