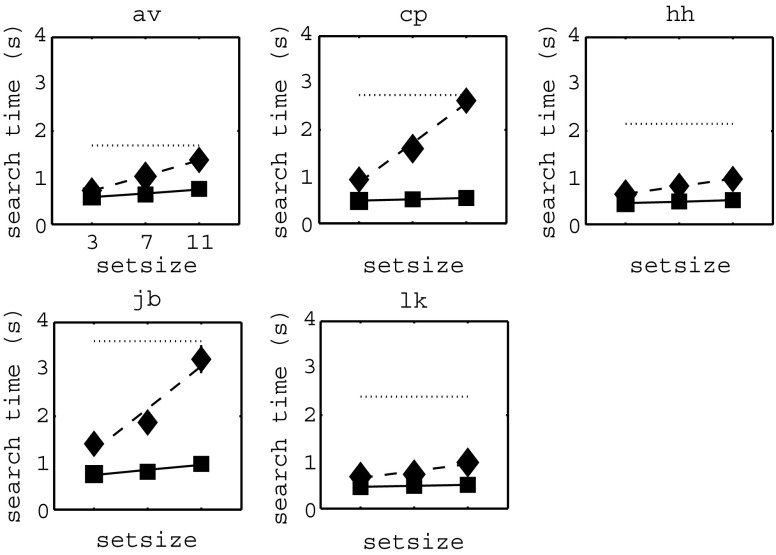
Fig. 5.
Results of Experiments 1 and 4. The dashed and solid lines and the squares and diamonds represent mean reaction times as in Fig. 2, but now for 5 individual observers. The dotted line represents the mean dominance duration for that observer. The results show that mean dominance duration were generally larger than the largest reaction times of Experiment 1

