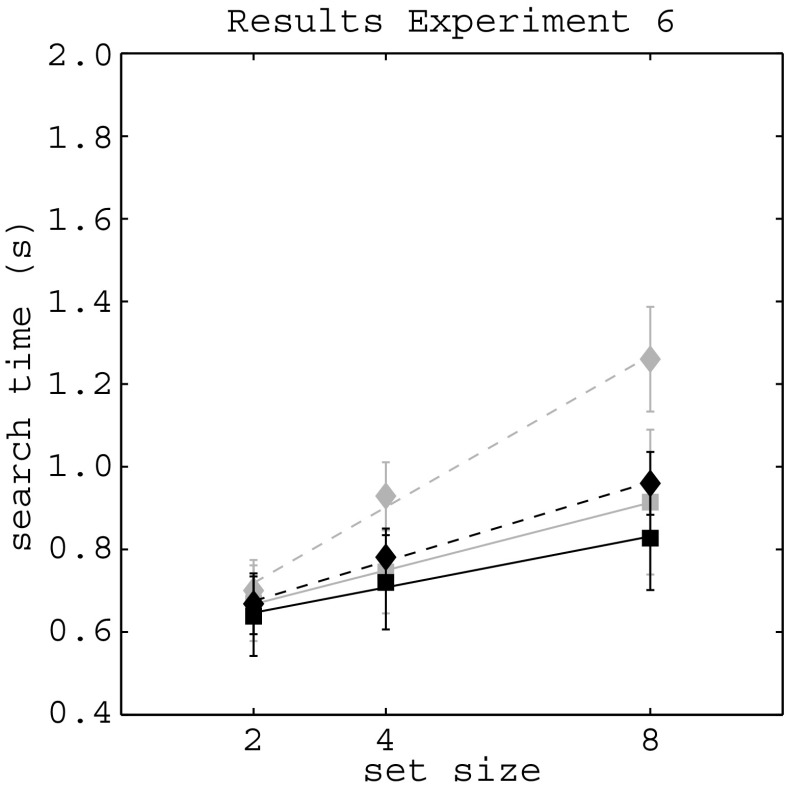
Fig. 8.
Results of Experiment 6: Mean search times (y-axis) for 5 observers as a function of set size (x-axis). The target-present data are presented in black, the target-absent data in gray. Squares represent search times for the conflict target conditions; solid lines are linear fits for the search times in these conditions. Diamonds represent search times for the conflict distractors conditions; dashed lines are linear fits for the search times in these conditions. Error bars represent standard errors of the means. The results are qualitatively similar to those of Experiment 5. Thus, removing the flicker from the stimulus did not lead to efficient search in the conflict target condition, nor did it lead to a search asymmetry

