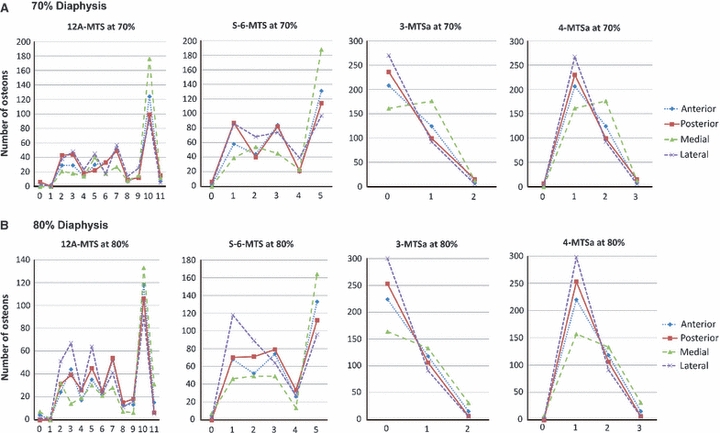
Fig. 14.

Mean data from anterior, posterior, medial, and lateral cortices of the 70% and 80% sections for the 12A-MTS, S-6-MTS, 3-MTSa, and 4-MTSa scores. The values along the x-axis (abscissa) are the individual osteon morphotype scores. Note that the S-6-MTS does not distinguish between alternating and distributed osteon morphotypes; these are lumped into the ‘distributed’ osteon group (scored as ‘5’, see Fig. 1).
