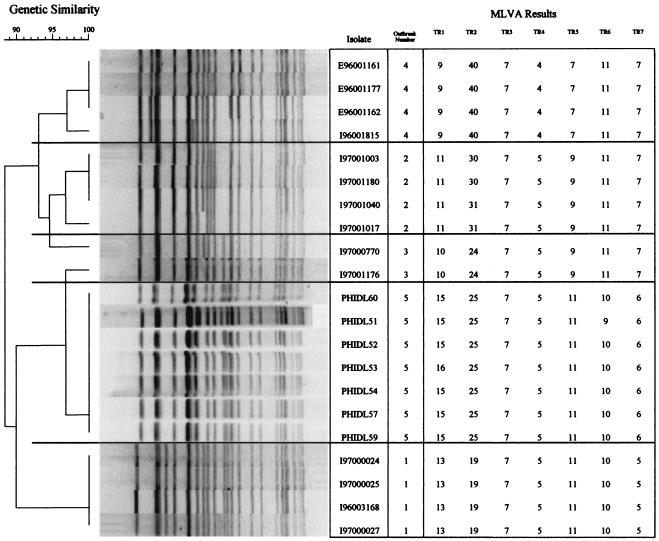
FIG. 2.
Types of all group 1 isolates from five outbreaks obtained by PFGE with XbaI and the corresponding MLVA types. The numbers under each TR locus reflect the number of times that the TR was found in that isolate. The horizontal lines through the dendrogram and chart are used to visually demarcate the outbreak isolates.

