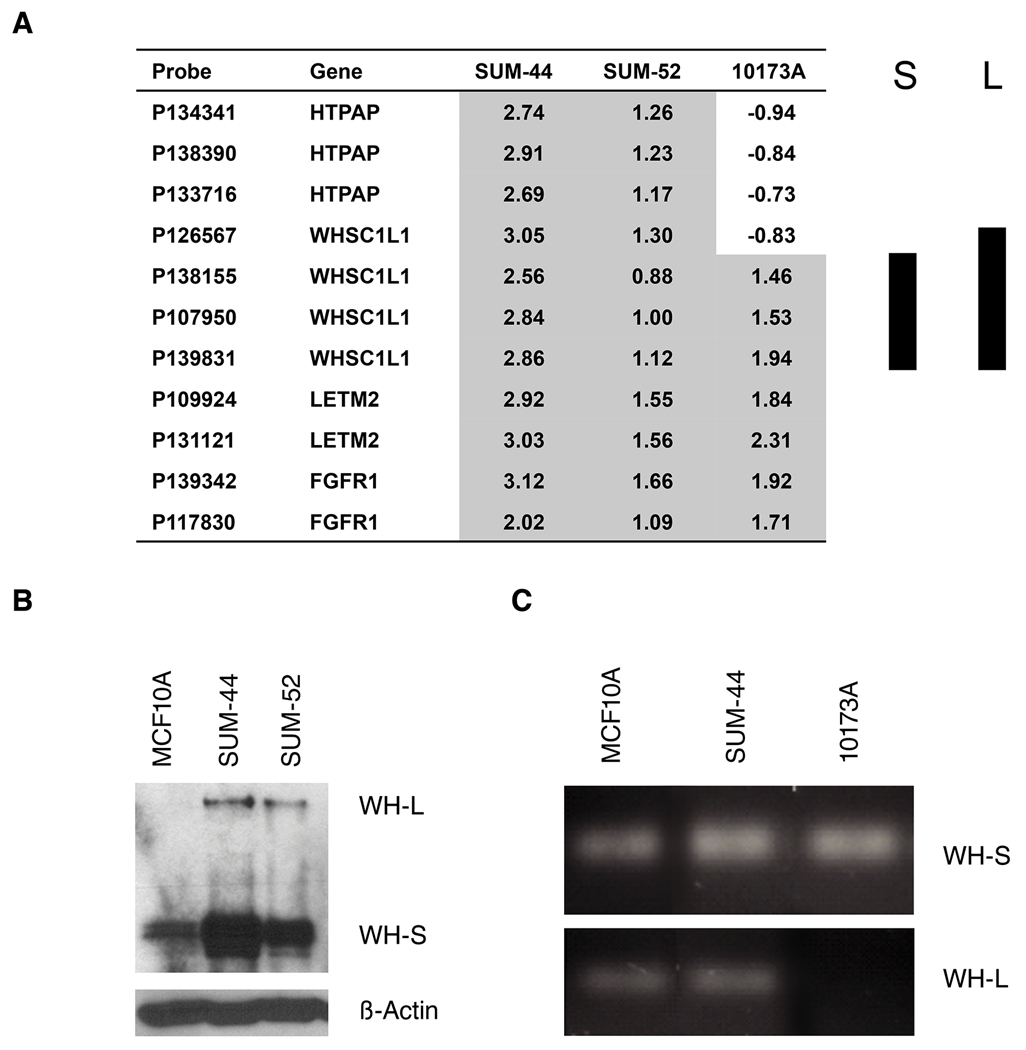
Figure 3.
(A) Genomic copy number profiles of the WHSC1L1 region analyzed on the Agilent oligonucleotide array CGH in two SUM breast cancer cell lines (SUM-44 and SUM-52) and one primary breast cancer specimen (10173A). Array probes and genes are displayed horizontally by genome position. Log2 ratio in each sample is relative to normal female DNA. S represents WHSC1L1 short isoform and L represents long isoform. (B) WHSC1L1 protein levels were analyzed by western blot in two breast cancer cell lines, SUM-44, SUM-52 and control MCF10A line. (C) Genomic PCR using primers specific for the short isoform exon 10 (S-10) and the long isoform exon 20 (L-20) of WHSC1L1 were used to validate array-CGH data in breast cancer specimen 10173A.

