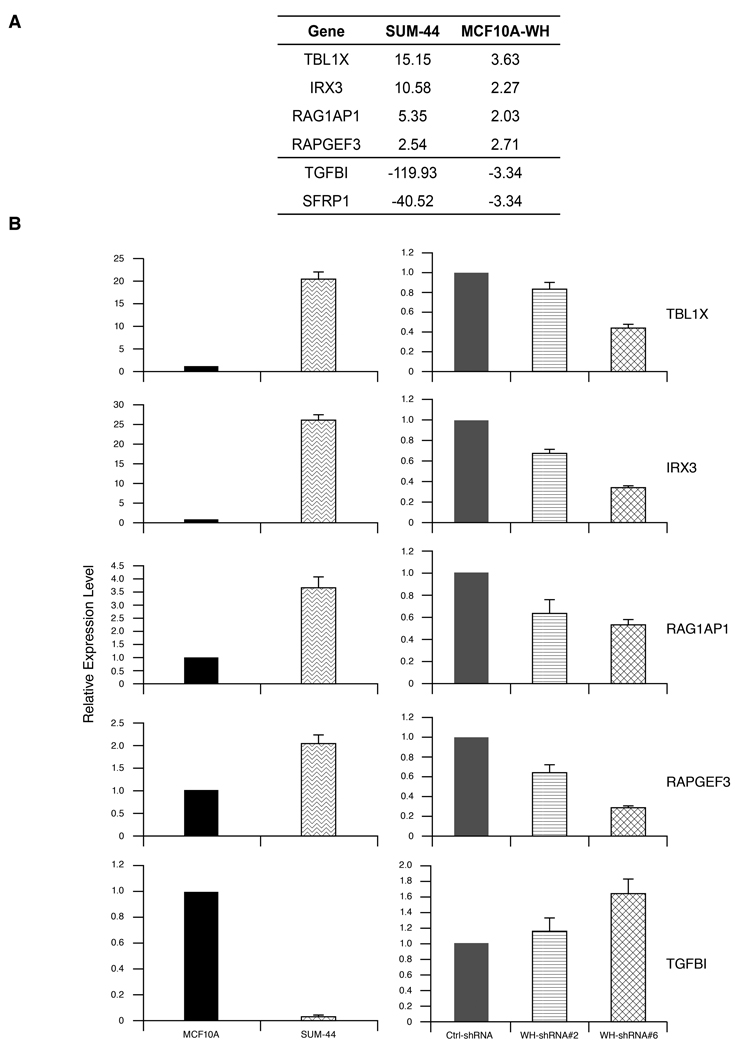
Figure 5.
(A) Six genes differentially expressed in both SUM-44 cells and MCF10A-WHSC1L1 cells, relative to MCF10A cells with the Illumina expression Beadarray. (B) TBL1X , IRX3, RAG1AP1, RAPGEF3 and TGFBI expression level was measured by semiquantitative RT-PCR in MCF10A, SUM-44 cell (left panels), and WHSC1L1 knock-down SUM-44 cells (right panels).

