Abstract
The objective of this study was to evaluate near infrared (NIR) spectroscopy and imaging as approaches to assess drug contents in poly(dl-lactide-co-glycolide) (PLGA) based nanoparticles of a model protein, cyclosporine A (CyA). A 6-factors 12-runs designed set of experiments with Plackett–Burman (PB) screening was applied in order to examine the effects of drug loading (X1), polymer loading (X2), emulsifier concentration (X3), stirring rate (X4), type of organic solvent (X5), and ratio of organic to aqueous phases' volumes (X6), on drug entrapment efficiency (EFF). After omitting the factors with nonsignificant influences on EFF, a reduced mathematical relationship, EFF = 48.34 + 7.3X1 − 29.95X3, was obtained to explain the effect of the significant factors on EFF. Using two different sets for calibration and validation, the developed NIR calibration model was able to assess CyA contents within the 12 PB formulations. NIR spectral imaging was capable of clearly distinguishing the 12 formulations, both qualitatively and quantitatively. A good correlation with a coefficient of 0.9727 was obtained for constructing a quantile-quantile plot for the actual drug loading percentage and the % standard deviation obtained for the drug loading prediction using the hyperspectral images.
Keywords: nanoparticles, encapsulation, biodegradable polymers, near infrared spectroscopy, partial least squares, cyclosporine A
Introduction
Cyclosporine A (CyA) is a potent immunosuppressive protein, which has been widely used for the prevention of graft rejection following organ transplantation such as kidney, liver, heart, lung and pancreas as well as in the treatment of various autoimmune disorders.1 CyA is available commercially in the form of self nanoemulsified formulation containing cremophor-EL and Labrafil as solvents in parenteral and oral preparations from Sandoz AG (Basel, Switzerland). The oral bioavailability of CyA is low and highly variable owing to its troublesome bio-pharmaceutical properties.2 CyA is a critical dose drug with a narrow therapeutic window and the commercial formulation exhibits dose dependent nephrotoxicity.1 The severity of symptoms that were observed outside the therapeutic window of CyA necessitates the development of less toxic CyA formulation that can control the blood levels of CyA in the therapeutic range.
Drug products can be developed by a traditional paradigm or a quality by design (QbD) paradigm. The QbD provides a framework for allowing regulatory processes to more readily adopt state-of-the-art technological advances in product development, process understanding and quality assurance. It shifts the focus from “quality by testing” to “quality by design” to build the quality into the process rather than rely on the resource-intensive quality control systems to prevent releases of defective products. In this prospect, a set of experiments with Plackett–Burman (PB) screening was adopted to develop a PLGA based nanoparticles of CyA. PB designs are screening designs that involve a large number of factors and relatively few runs.3 They are resolution 3 designs, so they can estimate only main effects. They are typically used to identify a few significant factors out of a large set.
Process analytical technology (PAT) is a system for designing, analyzing, and controlling manufacturing processes based on an understanding of the scientific and engineering principals involved and an identification of the variables which affect product quality.4 Effective PAT implementation can be founded on detailed, science-based understanding of the chemical and mechanical properties of all elements of the proposed drug product. NIR spectroscopy and imaging, Raman spectroscopy, Lasentec (focused beam reflectance measurement), fiber optics, biosensors, and others are evolving PAT tools. Due to the rapid and non-destructive nature of NIR spectroscopy, the robust instrumentation and the ability to interface a spectrometer with nearly any process through fiber-optics, many applications of this technique to pharmaceutical analysis were explored.5,6 NIR imaging is a combination of NIR spectroscopy with digital image processing. Conventional non-imaging NIR spectroscopy analyzes the sample in bulk and determines an average composition across the entire sample. NIR imaging, on the other hand, provides information about the spatial distribution of the components comprising the sample. It is, therefore, a powerful “line extension” of conventional NIR analysis.7 These spectroscopic techniques are well-suited for at-line, in-line, and on-line measurements. They can provide a wealth of chemical and physical information important for measuring process performance and opening up opportunities to move forward from traditional quality control concepts to process qualification and product conformity testing. The present research was aimed at utilizing both NIR spectroscopy and imaging for spectral and spatial characterization of CyA incorporated PLGA based nanoparticle through PB screening design.
Materials and Methods
Materials
Cyclosporine (Purity 99%) (Cas no.: CYC140175) was obtained from Poli Industria Chemica S.P.A. (Rozzano, Milano, Italy). Poly(lactic-co-glycolic acid) (PLGA, lactide:glycolide = 50:50, inherent viscosity: 0.58 dL/g in hexafluoroisopropanol, Mw ≈ 31,000 Da) was purchased from Lactel International Absorbable Polymers (Pelham, AL). Methylene chloride and chloroform (HPLC grade) was obtained from Fisher Scientific Co. (Norcross, GA). Sodium lauryl sulfate (Lot no.: 128H141215) was purchased from Sigma Chemical Co. (St. Louis, MO). Chemicals and raw materials were used as received without further processing.
Experimental Design
Screening designs are commonly used when a large number of factors are likely to affect a process. These designs, in general, are a fractional factorial of a 2n design that estimates main effects. They can identify main factors from a large number of suspected contributor factors for the desired response variables. Therefore, these designs are extremely useful in preliminary studies where the aim is to identify formulation variables that can be fixed or eliminated in further investigation.8 The Plackett Burman factorial design was employed in this study to correlate dependent and independent variables controlling the formulation of CyA loaded PLGA nanoparticles using the following polynomial model:
where Y is the response and X is the independent variable, he coefficients of the response values. The PB design analyzes the input data and presents a rank ordering of the variables with magnitude of effect, and designates signs to the effects to indicate whether an increase in factor value is advantageous or not.9 In this study, a screening of the effects of six independent variables, namely drug loading, polymer loading, emulsifier concentration, stirring rate, type of organic solvent and ratio of organic to aqueous phases volumes, on the drug entrapment efficiency (EFF) was investigated. The different levels for the independent variables are given in Table 1. These high and low levels were selected from the preliminary experimentation. After generating the polynomial equations relating the EFF and the independent variables, the process was optimized using a desirability function to maximize the EFF.
Table 1. Levels of Independent Variables in Plackett Burman Design.
| Formulation Number | Drug Loading, X1 (mg) | Polymer Loading, X2 (mg) | Emulsifier Concentration, X3 (%) | Stirring Rate, X4 (rpm) | Type of Organic Solvent, X5 | Organic to Aqueous Phases Ratio, X6 (v/v) |
|---|---|---|---|---|---|---|
| 1 | 50 | 200 | 0.05 | 900 | Dichloromethane | 1:10 |
| 2 | 50 | 200 | 0.1 | 600 | Chloroform | 1:20 |
| 3 | 50 | 200 | 0.1 | 600 | Dichloromethane | 1:20 |
| 4 | 50 | 400 | 0.05 | 600 | Chloroform | 1:10 |
| 5 | 50 | 400 | 0.05 | 900 | Chloroform | 1:20 |
| 6 | 50 | 400 | 0.1 | 900 | Dichloromethane | 1:10 |
| 7 | 100 | 200 | 0.05 | 600 | Chloroform | 1:10 |
| 8 | 100 | 200 | 0.05 | 900 | Dichloromethane | 1:20 |
| 9 | 100 | 200 | 0.1 | 900 | Chloroform | 1:10 |
| 10 | 100 | 400 | 0.05 | 600 | Dichloromethane | 1:20 |
| 11 | 100 | 400 | 0.1 | 600 | Dichloromethane | 1:10 |
| 12 | 100 | 400 | 0.1 | 900 | Chloroform | 1:20 |
Preparation of CyA Loaded Nanoparticles
PLGA nanoparticles loaded with CyA were prepared by an oil-in-water (O/W) emulsion/solvent evaporation technique, as described by Mok and Park.10 Typically, the aqueous emulsification solution was prepared by dissolving the specified amount of sodium lauryl sulfate in demineralized water at room temperature. The organic phase was prepared by dissolving the required amounts of CyA and PLGA in 10 mL of either dichloromethane or chloroform. The organic phase was gradually added to the specified volume of the emulsification solution in two organic to aqueous phases' ratios of 1:10 and 1:20 (v/v) with constant stirring using Lightnin Stirrer (General Signal Co., Stamford, CT). The resultant mixture containing both organic and aqueous phase was homogenized at 6000 rpm for 10 min using a probe-type PowerGen 125 homogenizer (Fisher Scientific, Pittsburgh, PA). Complete organic solvent evaporation and subsequent hardening of the nanoparticles were achieved by stirring the mixture at either 600 or 900 rpm for 4 h. The resulting nanoparticles were harvested from the aqueous solution by centrifugation at 49,500g for 2 h using Sorvall/Thermo RC-5C centrifuge (Thermo Scientific, Sugar Land, TX). Two washing cycles were applied to the nanoparticles using 5 mL of demineralized water each followed by freeze drying in Freeze-Dry/Shell Freeze System (Labconco Corp., Kansas City, MO). All formulations were stored in a closed container away from the light and humidity until use.
Nanoparticle Characterization
The size of PLGA nanoparticles was analyzed by a dynamic light scattering using a Nicomp particle sizing system (Nicomp PSS ZW 380, Agilent Technologies, CA). For this purpose, 5 mg of the freeze-dried nanoparticulated powder were suspended in 5 mL of demineralized water followed by bath sonication for 2 min. Surface morphology of nanoparticles was visualized by scanning electron microscopy (SEM; XL30 ESEM, FEI Company, Hillsboro, OR). Nanoparticle powder were fixed to aluminum sample stubs with double-sided carbon tape and sputter coated with gold for viewing and assessing the particle surface properties. EEF of CyA was determined by measuring the total amount of CyA loaded in each 5 mg sample (i.e., experimental core loading) and comparing this value with the expected amount of CyA in each of the samples based on the drug loading during the preparation (i.e., theoretical core loading). The EEF was calculated using the following equation:
where Dt is the amount of CyA loaded to PLGA solution and Dm is the amount of CyA in the prepared nanoparticles. Experiments were run in triplicate. The actual drug load was determined by dissolving 5 mg of the freeze dried nanoparticles in 5 mL of chloroform at 37°C with agitation.6 One hundred microliters of the obtained solution was diluted with 900 μL of the mobile phase for CyA quantitation using a Hewlett Packard (HP) HPLC instrument (Agilent Technologies) consisted of a quaternary HP 1050 pump, HP 1050 autosampler, and 1050 HP UV detector set at a wavelength of 203 nm. The built in HP thermostatted column compartment was set at 70°C. The HPLC stationary phases was composed of a C8, 4.6 mm × 250 mm (3.5 μm packing) reverse phase chromatography Zorbax SB-C8 column and a C8, 4.6 mm × 12.5 mm (5 μm packing) Zorbax SB-C8 reliance guard column (Agilent Technologies). The mobile phase consisted of acetonitrile:methanol:water:phosphoric acid (8:4:3:0.05) and was pumped isocratically at a flow rate of 1.25 mL/min.
NIR Spectroscopy
For the 12 PB formulations, NIR spectra were collected using a Foss NIR systems spectrometer equipped with Rapid Content™ Analyser (AP-2020, Model 5000, Foss NIR Systems Co., Eden Prairie, MN) and a diffuse reflectance apparatus over the range 1100–2500 nm. Sample analysis occurred by scanning directly through the base of the sample vials. Sample vials were borosilicate shell vials with crimp polyethylene caps of 15 mm × 45 mm size and 4 mL capacity. In order to exclude any source of variability due to the vials used for collecting NIR spectra, vials from the same batch were used for spectra acquisition for all samples. Cho et al.11 reported that glass vials are transparent to NIR beam and do not affect the obtained spectra. Spectra were collected in sextet to include any intra-sample variation, with rotation of the vials among scans to ensure representative spectra. Using a pressed polytetrafluoroethylene (PTFE) powder packed in the same glass vials used for the samples, internal software evaluated the spectrum of the apparent reflectance. Spectral acquisition configuration for the reflectance mode involved using a tungsten–halogen lamp, quartz beam splitter and a room temperature-indium gallium arsenide (InGaAs) detector. Spectral processing and chemometric analysis were performed using Unscrambler v9.2 software (CAMO, Trondheim, Norway). Reflectance values were linearized with a log(l/R) transformation. To minimize baseline shifting due to sample positioning or intensity, all spectra were preprocessed with the third order polynomial Savitzky–Golay second derivative treatment with a filter width of 11 data points.12 Samples were divided into calibration and validation sets after sorting according to the measured drug loading percentage from the destructive entrapment experiment. Formulations 1, 2, 4, 5, 6, and 7 were assigned to the calibration set and formulations 3, 8, 9, 10, 11, and 12 made up the validation set. Partial least squares (PLS) regression was used to develop the calibration and validation models (n = 36 each) for predicting the actual drug loading percentage. The optimum number of PLS factors for calibration was that which gave a minimum validation error. Calibration and validation performances were evaluated as the multiple coefficient of determination (R2) and root mean square standard error of calibration and validation (RMSEC and RMSEP).
Near Infrared Chemical Imaging
NIR chemical imaging is similar to traditional single point spectroscopy in that the sample is illuminated with NIR radiation and the resulting reflected radiation is directed towards a sensitive detector. The major difference is the simultaneous acquisition of tens of thousands of spatially resolved spectra versus a single spectrum. This is enabled by the use of a two-dimensional NIR detector, the focal plane array (FPA). The image data sets for the 12 PB freeze dried nanoparticulated powders were collected by the Sapphire™ NIR Spectral Imaging System (Spectral Dimensions, Inc., Olney, MD). No sample preparation was required. Samples were held over a locally made aluminum plate having a 5 mm hole to hold the nanoparticle powder. The imaging system consists of a liquid crystal tunable filter (LCTF) coupled with an NIR sensitive FPA detector. The diffuse reflectance image of the sample is passed through the LCTF. The tunable filter element rapidly selects wavelengths over a spectral range of 1200–2450 nm. A series of images are then captured by the indium–gallium–arsenide near infrared FPA detector with a total acquisition time of ∼2 min per sample. Each pixel in the detector array corresponds to ∼1600 μm2 (40 μm × 40 μm) area of the powder surface and the resulting data set contains 125 wavelength increment scans per spectrum. The data sets are generally referred to as image cubes or hyper-spectral image cubes.
Data were analyzed using ISys™ 5.0 software (Spectral Dimensions Inc.), a graphical user interface, and an integrated software package designed specifically for the acquisition, visualization and analysis of hyper-spectral image cubes and maps. Localized NIR spectra associated with each pixel and images associated with each NIR wavelength are readily displayed. Spectral data were converted to absorbance according to the following equation:
where A is the absorbance and R is the reflectance, obtained by processing the sample (S), dark (D), and background (B) image cubes as follows:
The dark cube (D), collected with camera looking at a mirror (no reflectance), represents primarily the dark current. The background cube (B) or 99% reflectance reference cube, is acquired with camera looking at a reflectance reference (Spectralon-99 or white ceramic plate), and represents maximum signal collected from a uniform, highly reflecting body. Finally, the sample cube contains raw images of sample, which are converted to reflectance data using the above calculation. The pixels with the very high reflectance corresponding to the aluminum slides holding the powders were masked from the images. A partial least squares regression was performed on a data set containing in each row the spectral mean vector of all pixels spectra in each formulation's image. Several pre-processing methods such as multiplicative scatter correction (MSC), standard normal variate (SNV) and derivatives were used to treat the spectral data. The best performance in visualizing groups in the data was found with third order polynomial Savitzky–Golay second derivative with a filter width of 11 data points which is in accordance with the preprocessing treatment used for conventional NIR spectroscopic analysis. In order to visualize the differences between and within formulations' images (e.g., different spatial distributions of components within a nanoparticulate powder), a library was built from the pure component spectra representing this binary system (CyA and PLGA). The spectral absorbance for each pixel was decomposed into score values associated with each component. The intensity values for the PLS score images shown represent the score values for class 1, the drug. The discrimination among the different formulation based on the drug loading could be seen qualitatively from the NIR images by visual inspection. Moreover, a quantitative measure of the percentage drug loading was established by calculating the percentage standard deviation of the distribution of pixel intensities as represented by the histograms of the PLS score images.
Results and Discussion
Statistical Design and Analysis
The PB screening design was used in the present investigation to evaluate the main effects of six independent variables controlling the entrapment of CyA within PLGA nanoparticles. While the PB design does not evaluate the interaction terms, it considerably reduces the number of experiments that are required to evaluate the main effects. A 6-factor 12-run PB screening design at two levels was generated using JMP 7 (SAS, SAS Institute, 100 SAS Campus Drive, Cary, NC) statistical experiment design software (Table 1). The response estimated in the present work was CyA entrapment efficiency within the developed nanoparticles. The response parameters and their magnitudes for each of the 12 experiments are given in Table 2. The effects of the independent variables on the particle size and the surface morphology of the prepared nanoparticles were investigated. Based on the experimental design generated, the factor combinations resulted in a variation in particle size. A particle size ranged from 41.60 ± 0.3 nm for formulation no. 7 to 372.80 ± 1.1 nm for formulation no. 4 that was prepared with double the amount of PLGA in the organic phase. The larger particle size was probably caused by the increasing viscosity of dispersed phase (polymer solution), resulting in a poorer dispersability of the PLGA solution into the aqueous phase.13 Quintanar-Guerrero et al.14 attributed this fact to the greater probability that the desolvated macromolecules coalesce in a more concentrated solution, thereby forming larger particles. Figure 1 shows the surface morphology of the CyA loaded PLGA nanoparticles. The nanoparticles formulated are well formed, spherical, smooth and non-porous.
Table 2. Observed Entrapment Parameters for the 12 Formulations of PB Design.
| Formulation Number | Percentage Theoretical Drug Loading | Percentage Actual Drug Loading | Percentage Actual PLGA Loading | Entrapment Efficiency |
|---|---|---|---|---|
| 1 | 20 | 17.3 ± 0.02 | 82.7 | 86.62 ± 0.09 |
| 2 | 20 | 2.1 ± 0.01 | 97.9 | 10.31 ± 0.04 |
| 3 | 20 | 2.2 ± 0.00 | 97.8 | 11.17 ± 0.00 |
| 4 | 11.1 | 5.5 ± 0.00 | 94.5 | 49.26 ± 0.02 |
| 5 | 11.1 | 7.3 ± 0.01 | 92.7 | 65.74 ± 0.13 |
| 6 | 11.1 | 2.6 ± 0.00 | 97.4 | 23.25 ± 0.04 |
| 7 | 33.3 | 31.0 ± 0.03 | 69.0 | 93.07 ± 0.08 |
| 8 | 33.3 | 29.2 ± 0.02 | 70.8 | 87.68 ± 0.05 |
| 9 | 33.3 | 10.8 ± 0.00 | 89.2 | 32.35 ± 0.01 |
| 10 | 20 | 17.5 ± 0.01 | 82.5 | 87.44 ± 0.03 |
| 11 | 20 | 4.6 ± 0.01 | 95.4 | 23.22 ± 0.06 |
| 12 | 20 | 2.0 ± 0.01 | 98.0 | 10.62 ± 0.06 |
Figure 1.
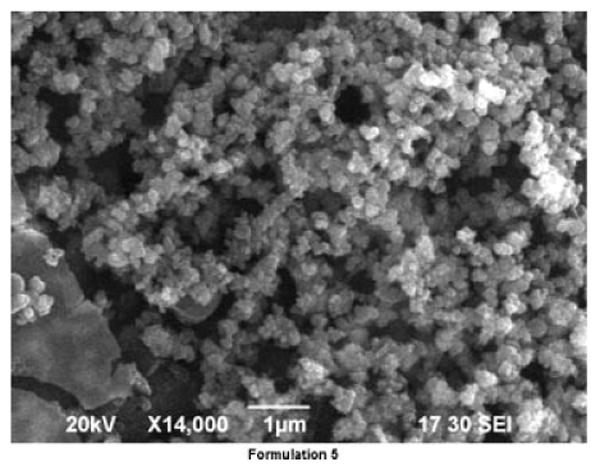
SEM images of CyA loaded PLGA based nanoparticles (formulation 5).
The factor combinations provided different EFF. The range of the EFF was 10.2 ± 0.06% for formulation no. 12 (minimum) and 93.0 ± 0.08% for formulation no. 7 (maximum). The mathematical relationship in the form of factor coefficients and their corresponding p-values for the measured EFF is listed in Table 3. Coefficients with p-value less than 0.05 had a significant effect on the model for the measured EFF. The confidence that the regression equation would explain the observed values better than the mean for EFF was 95.53%. Concerning the p-value of the coefficients, only X1 (theoretical drug loading) and X3 (emulsifier concentration) were found to have significant effects on the model performance. In order to generate a reduced regression equation for EFF prediction, factors with non significant effects were omitted from the full model while keeping only factors with significant effects. The reduced polynomial equation relating the EFF and the independent variables was:
Table 3. Regression Equation and ANOVA Parameters for Predicting CyA EFF.
| A | X1 | X2 | X3 | X4 | X5 | X6 | |
|---|---|---|---|---|---|---|---|
| Yi | 48.34 | 7.3 | −5.16 | −29.95 | 2.62 | 4.86 | 2.94 |
| p-Value | 0.0001 | 0.0456 | 0.1199 | 0.0001 | 0.3842 | 0.1383 | 0.3345 |
| Source | df | Sum of Squares | Mean Squares | F-Ratio | Prob > F | ||
|
| |||||||
| ANOVA | |||||||
| Model | 6 | 12194.9 | 2032.5 | 22.26 | 0.0018 | ||
| Error | 5 | 458.3 | 91.27 | ||||
| Cumulative total | 11 | 12651.3 | |||||
A coefficient with positive sign represents a synergistic effect of the factor on the response, while a negative sign indicates an antagonistic effect. The obtained regression analysis revealed a synergistic effects of the drug loading, stirring rate, organic to aqueous phases' ratio and the use of dichloromethane as the organic solvent for both the drug and the polymer on the EFF. On the other hand, antagonistic relationships existed between the EFF and either the polymer loading or the emulsifier concentration in the aqueous phase. The values of X1–X6 were substituted in the equation to obtain the theoretical values of EFF. The quantile–quantile relationship of plotting the measured EFF against the predicted EFF yield a linear correlation with R2 = 0.9639 indicating the validity of the method to predict the EFF within the independent variables selected (Fig. 2). The significance of the ratio of mean square variation due to regression and residual error was tested using analysis of variance (ANOVA). In ANOVA, the “Prob > F” parameter is the observed significance probability (p-value) of obtaining a greater F-value by chance alone if the specified model fits no better than the overall response mean. Observed significance probabilities of 0.05 or less are often considered evidence of a regression effect. A Prob > F of 0.0018 indicated a significant effect of the independent factors on the EFF (Tab. 3).
Figure 2.
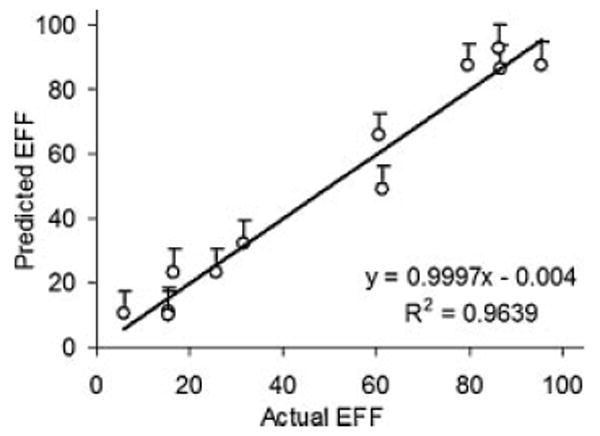
Quantile–quantile plot for EFF prediction using the full calibration model.
The relationship between the dependent and independent variables was further elucidated using contour and response surface plots. The effects of drug loading and polymer loading on EFF are given in Figure 3. Increasing the theoretical drug loading (X1) from 50 to 100 mg resulted in an increase in the EFF from 56.6 to 71.3% and from 46.4% to 60.8% at low and high levels of X2 (polymer loading), respectively. The decreased EFF at lower drug loadings compared to the higher loadings was assumed to be due to the higher relative percentage of the total drug lost at the steps of the fabrication process.15 On the other hand, a negative correlation existed between the EFF and the polymer loading at both low and high levels of the drug loading. A possible explanation of this is the fact that polylactide oligomers have interestingly been shown to have similar surface tension reducing effects as sodium dodecyl sulfate16 which facilitates the diffusion of hydrophobic drugs to the aqueous phase. Similarly, the incorporation of oligomeric polylactide in the organic phase of the lipophilic drug has been shown to be an effective stabilizer, which introduces carboxylate groups at the oil/water interphase to provide emulsion stabilization by electrostatic repulsion.17,18 This is in agreement with the findings stated by Liggins and Burt19 of another study that reported partitioning of 33.3% of their polylactic acid polymeric matrix to the aqueous phase.
Figure 3.
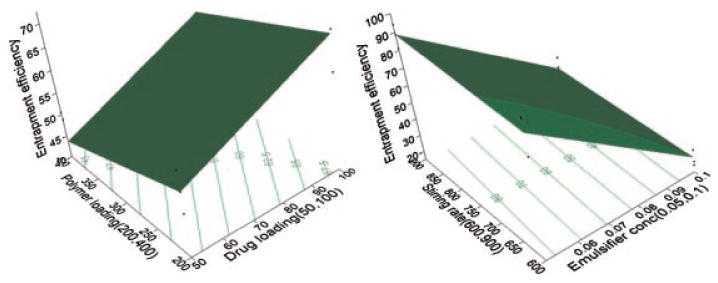
Response surface (3D) and contour plots showing the effect of the drug loading (X1), polymer loading (X2), emulsifier concentration (X3), and stirring rate (X4) on the EFF.
The role of added emulsifier to the aqueous medium (X3) and X4 (stirring rate) on the EFF can be discussed with the aid of Figure 3. As shown in the figure, at either low or high stirring rate, the EFF greatly decreased by increasing the surfactant concentration in the aqueous phase. On the other hand, little contribution of stirring rate to affect the EFF was observed. This result explained the significant positive role of the emulsifier to partition the hydrophobic drug to the aqueous medium and further lower entrapment.20 The emulsifier has a tendency to form miceller aggregates which have a tendency to solubilize the lipophilic drug molecules inside the hydrophobic core resulting in an increased solubility of the lipophilic drugs and further lower entrapment.
Changing both the type of organic solvent employed and the organic to aqueous phases' ratio did not have a significant (p < 0.05) effect on the drug entrapment in the nanoparticles. The physicochemical properties of the employed solvents like viscosity, vapor pressure, and surface tension could play a crucial role in the overall particle properties. Nevertheless, none of the solvents tested could significantly influence the EFF suggesting the least possible role of organic solvent on CyA entrapment under the studied conditions. Similar results were observed for other study to entrap CyA within PLGA systems by the emulsion diffusion evaporation method.21 Even though the EFF did not change significantly when the organic to aqueous phases' ratio was increased from 1:20 to 1:10 (v/v), the mean absolute drug loading decreased significantly from 60.6% to 45.6% by decreasing the theoretical drug loading from 100 to 50 mg at the two levels of the organic to aqueous phases' ratios. The explanation is that the same percentage of the drug was encapsulated employing either of CyA levels, so the absolute amount of drug in micrograms per milligram nanoparticles increased when the concentration of drug in the organic phase increased.
The main effect of the independent variables on the EFF was further investigated using a Pareto chart (Fig. 4). The length of each bar in the graph indicates the estimates of effects of these factors and the level of their effects on responses. It can be inferred that the factor X3 (emulsifier concentration) is the most important factor controlling the EFF followed by factor X1 (theoretical drug loading). The nonsignificant factors can also be ranked according to their estimated influence on EFF as follows: X2 (polymer loading) > X5 (type of organic solvent employed) > X6 (ratio of organic to aqueous phases (v/v) > X4 (stirring rate). Having studied the effect of independent variables on the EFF, the levels of these factors were determined by using a desirability function to maximize the EFF. The predicted value of EFF was 101.2 ± 18.7% at X1, X2, X3, X4, X5, and X6 levels of 100 mg, 200 mg, 0.05%, 900 rpm, dichloromethane, and 1:10 (v/v), respectively. As a confirmation process, a fresh formulation was prepared with the optimized values of the independent variables that yielded an EFF of 100%. This demonstrated the feasibility of quality by design to understand the process of CyA entrapment within PLGA based nanoparticles.
Figure 4.
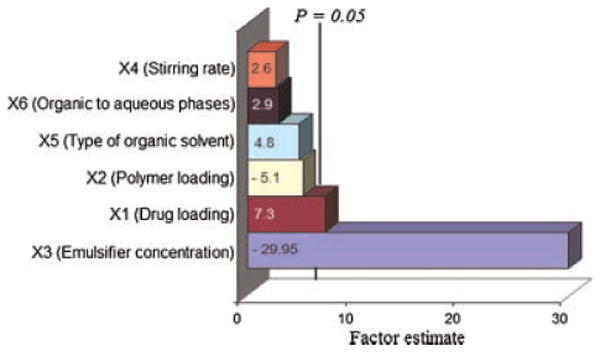
Standard Pareto chart showing the effects of independent variables on the EFF.
NIR Spectroscopy
The information found in the literature for monitoring the actual drug loading within biodegradable nanoparticles by NIR tools is very scarce. Therefore, the study included a nondestructive investigation of the ability of NIR spectral features to detect the amount incorporated of CyA within the 12 formulations of PB design. Figure 5 (part A) illustrates the influence of changing the six independent variables on the spectral raw data of PB formulations between 1000 and 2300 nm. It is a fact that dissimilar packing densities of particles cause variations in the recorded reflectance spectra due to scattering and thus differences in the light path length.22 Baseline shift of the spectrum is one of the main sources of error in NIR calibration models.23 In order to develop a robust calibration and enhance the small reflectance differences present among the spectra, baseline shifting must be removed. To achieve this goal and to improve NIR spectral bands' resolution, second derivative spectrum for assessment of actual drug loading within the samples was used by means of a Savitzky–Golay filter using 11 data points filter and a third order polynomial (Fig. 5, part B).
Figure 5.
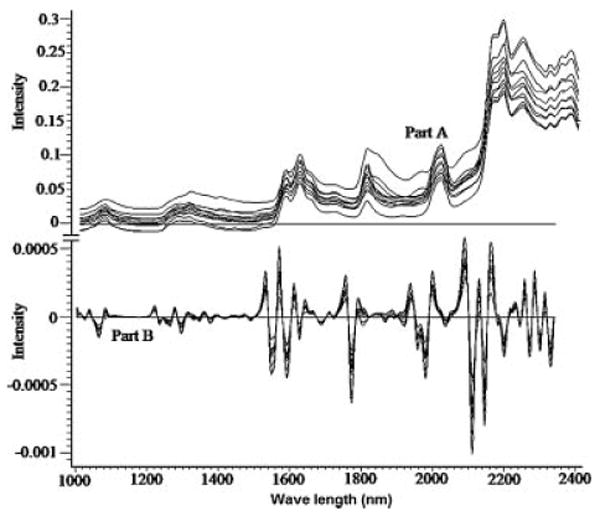
Raw NIR absorbance (part A) and second derivative (part B) spectra of the 12 formulations of PB design.
The 12 formulations of PB design were divided into two sets to have a similar range of the actual drug loading per each set. The first set, calibration samples, encompassed formulations 1, 2, 4, 5, 6, and 7 that covered a range of actual drug loading percentages of 2.1–31%. Formulations 3, 8, 9, 10, 11, and 12 made up the second set, validation samples, to cover a drug loading percentages range of 2–29.2% (Tab. 2). The principal component analysis (PCA) was applied using three principal components to perform a preliminary study of the structure of the data. Figure 6 shows the scores of the second principal component (PC2) versus the first principal component (PC1) of calibration and validation data set, which represents ∼97% of data variance. The model shows a satisfactorily clustering of the 12 formulations into four groups according to their actual drug percentage. Approximately at score value of PC1 of 0.0012, 0.0004, 0.0003, and −0.001, the four groups were arranged according to their drug content as group 1 > group 2 > group 3 > group 4. This suggests that PC1 is related to the amount incorporated of CyA within the nanoparticles.
Figure 6.
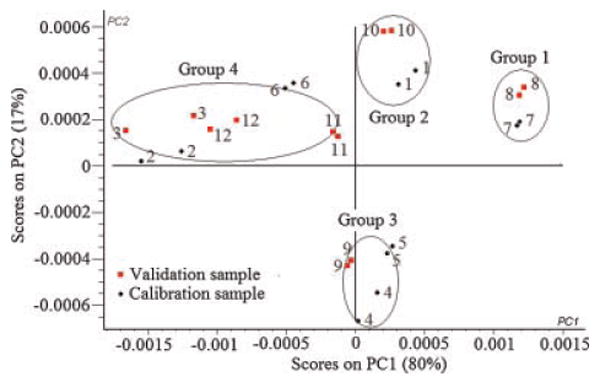
NIR spectra of the 12 formulations of PB design data projected onto PC1 and PC2 computed by principal component analysis.
PLS regression is a full spectrum method that extracts PLS factors from whole wavelength regions and correlates the spectral data in these regions with the property of interest.24 In this study, PLS was adopted for the model development using both the calibration and validation sets selected. It was found that the first PLS factor (PLS1), PLS2, and PLS3 were explaining 84%, 8%, and 8% of the total variance in the spectra, respectively. Figure 7 shows the relationships between the actual and the predicted percentage drug loading using the three PLS factors. The predicted values were reproducible and had a reasonable standard deviation. Using 36 spectra for each set, the calibration and prediction linear plots showed slopes of 0.9988 and 0.9814, offsets of 0.0125 and 0.6175, correlation coefficients of 0.9994 and 0.9975 and root mean square standard errors (RMSEC and RMSEP) of 0.34% and 0.81%, respectively. In order to assess the accuracy of the PLS method, the mean bias and the mean accuracy were determined by the following equations:25
Figure 7.
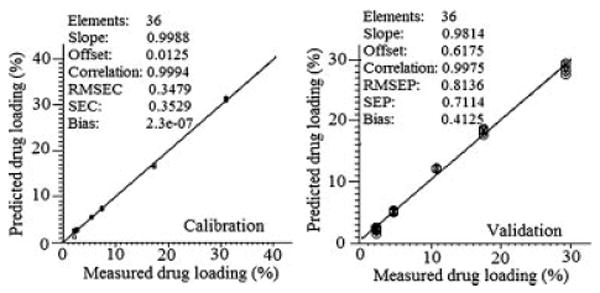
Calibration and validation plots of measured versus predicted drug loading percentages using three PLS factors.
where Bm is the percentage mean bias, Am is the percentage mean accuracy, Xc is the predicted drug loading value, Xt is the actual drug loading value, and n is the number of experiments. The mean bias and mean accuracy for the drug loading evaluation were calculated to be 0.41% and 1.52%, respectively. The result suggested the accuracy of the investigated model to predict the drug loading from the NIR spectra. The obtained relative error values were small compared to the original values, suggesting that the robust nature of the calibrations is evident.
Each PLS factor explains a certain portion of the overall spectral and chemical information in the model. This information is given as percent explained variance for the spectral and chemical part of the model. In order to understand the model structure and find wavelength regions relevant to the variability among the spectra, the loading vectors were analyzed for these three PLS factors and compared to the second derivative spectra of the individual components of the systems. Figure 8 shows the loading vector corresponded to PLS1, PLS2, or PLS3. PLS1 loading vector showed a plateau with positive peaks at 1660, 1884, and 2086 cm−1 and negative peaks at 1690, 1724, 1906, 1924, and 2268 cm−1 which are attributed to CyA component of the nanoparticulate powder. The positive peaks at 1680, 1724, 2098, 2122, 2254, and 2290 cm−1 and negative peaks at 1654, 1698, 1742, 1772, 2232, 2274, and 2312 cm−1 were the characteristic peaks for PLS2 which is attributable to PLGA. PLS3 loading vector showed only one positive peak at 1904 cm−1 and two negative peaks at 1886 and 1928 cm−1 which can explain the variability due to particle sizing change or the physical characteristics of the prepared systems. These results showed that the NIR spectral characteristics are useful tool for real time monitoring and control of CyA loaded PLGA based nanoparticles. Moreover, this operational procedure, involved in NIR, is simple and nondestructive, while the time required for measurement is only a few minutes.
Figure 8.
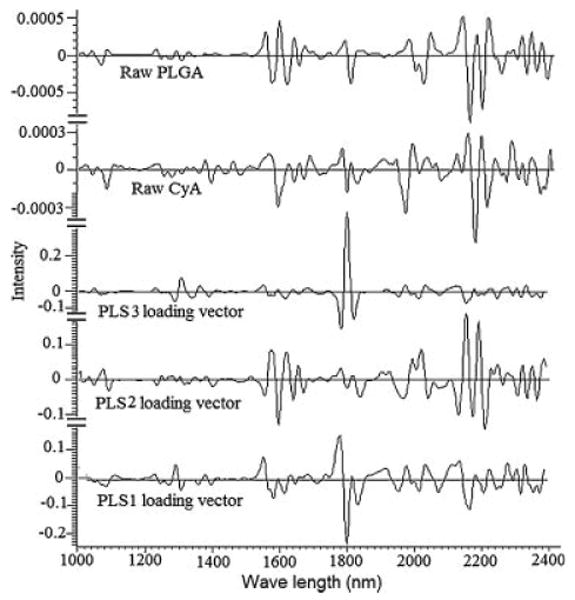
Loading vectors of the three PLS factors and second derivative spectra of the individual components.
Near Infrared Imaging
In classical NIR spectroscopy a spectrum reflects the integrated spectral information of the sample surface which depends on the spot size generated by the beam of light. Recently, NIR imaging systems became available for acquiring spectral and spatial information simultaneously. The spatial locations of the spectra identify chemical species inside the samples and map their distributions. In order to expand this concept to PLGA based nanoparticles, the current study characterizes quantitatively the spatial distribution of the chemical species within the prepared 12 PB formulations for the prediction of their drug loading. This technique effectively probes the chemical heterogeneity of CyA and PLGA by generating image contrast based on the absorbance at a particular wavelength for all pixels in the image. PLS score images of the 12 formulations of PB design concatenated according to the first class in the prebuilt PLS library, CyA component, are shown in Figure 9. The corresponding histograms represent distribution of pixel values about a mean value based on class 1 (CyA). These 12 PLS score images were processed together and were normalized to the same contrast scale. As a result, the spatial distribution of the drug and PLGA are visualized. This is a tremendous procedure to “mine” both spatial and chemical variance within the samples. PLS images and the localized histograms of all the formulations show a uniform distribution of components and a minimum of contrast. Moreover, the 12 histograms exhibit symmetric distributions. The obtained result indicates the efficiency of the method used to prepare spatially homogenous products.
Figure 9.
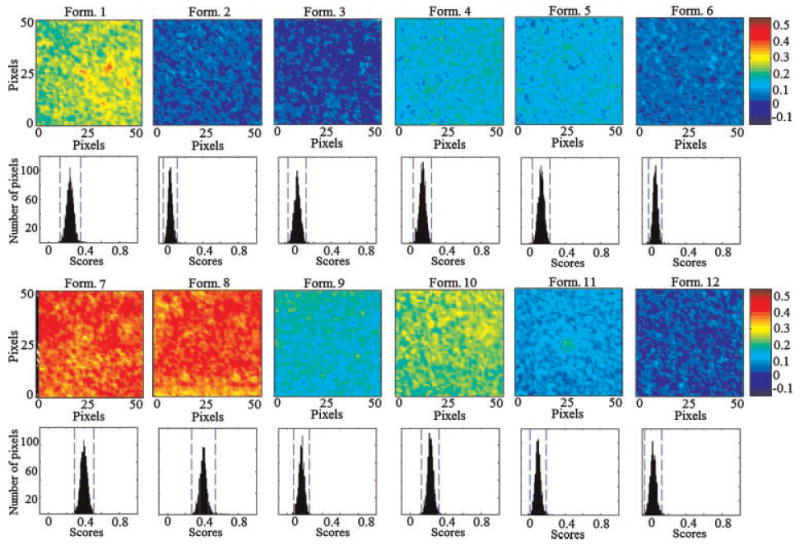
NIR PLS images and associated PLS histograms of the 12 PB formulations. The same scale is used for all the images, with the highest intensity representing CyA and the lowest intensity representing PLGA.
The width of the distribution shown in each histogram is a quantitative indicator of the heterogeneous spatial distribution of CyA within each sample. The % standard deviation of the population was used as a quantitative measure of the actual drug loading within each sample. Therefore, a statistical evaluation of the % standard deviations (relative to the mean) and the skewness of the histograms generated by the PLS score images are shown in Table 4. The 12 histograms exhibit low skewness values and hence symmetric distributions. It could be shown that the formulations can be arranged according to their % standard deviations generated from the corresponding PLS images. The same arrangement could be observed from the visual examination of the 12 PLS images. Comparing the enriched spectral character of CyA in the high intensity pixels in the five batches, one can arrange the formulations according to its drug contents as formulation 8 ≥ 7 > 1 > 10 > 9 > 4 > 5 > 11 > 6 > 2 > 12 > 3. A quantile–quantile plot was constructed for the actual drug loading percentage and the % standard deviation obtained for the drug loading prediction using the PLS score images (Fig. 10). A good correlation with a coefficient of 0.9727 was obtained explaining the validity of the model for the nondestructive drug assessment within PLGA based nanoparticles.
Table 4. Variability of PLS Histogram Distributions from PLS Score Images of the 12 Formulations of PB Design.
| Formulation Number | Number of Pixels in Each Image | Percentage Standard Deviation | Skewness |
|---|---|---|---|
| 1 | 2486 | 0.26 ± 0.03 | −0.022 |
| 2 | 2486 | 0.03 ± 0.002 | 0.123 |
| 3 | 2489 | 0.01 ± 0.03 | −0.051 |
| 4 | 2488 | 0.14 ± 0.03 | −0.074 |
| 5 | 2491 | 0.13 ± 0.03 | −0.10 |
| 6 | 2490 | 0.05 ± 0.02 | 0.056 |
| 7 | 2496 | 0.40 ± 0.04 | −0.019 |
| 8 | 2461 | 0.40 ± 0.04 | 0.029 |
| 9 | 2492 | 0.16 ± 0.02 | −0.019 |
| 10 | 2488 | 0.23 ± 0.03 | −0.018 |
| 11 | 2477 | 0.09 ± 0.02 | 0.079 |
| 12 | 2489 | 0.03 ± 0.003 | 0.004 |
Figure 10.
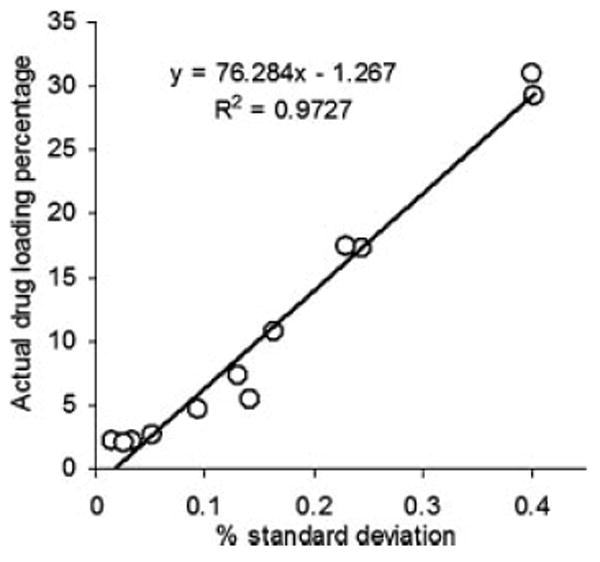
Quantile–quantile plot for the prediction of drug loading percentage using PLS score images' pixels intensities.
Traditional NIR spectroscopy was limited in its ability to evaluate powdered drug product homogeneity. The qualitative aspect associated with mapping the spatial distribution is lacking with this approach. NIR spectral imaging was capable of assessing the quality of the prepared nanoparticles both qualitatively and quantitatively. Compared to traditional NIR spectroscopy, NIR spectral imaging provided the opportunity to investigate localized microdomains within biodegradable nanoparticles. A physical or chemical abnormality that makes a minimal contribution to nanoparticles may go undetected by traditional NIR spectroscopy. The same abnormality could dominate a microdomain and be detected in the NIR image. In conclusion, the NIR spectral imaging system provides a rapid approach for acquiring high-resolution spatial and spectral information on CyA loaded PLGA based nanoparticles.
Conclusion
An integrated multivariate approach was developed to determine the EFF of a therapeutic protein, namely CyA, within a biodegradable PLGA based nanoparticles using NIR spectroscopy and imaging. As a QbD approach, PB design was applied to screen the formulation variables affecting CyA entrapment by the emulsion/solvent evaporation technique. The results inferred that the emulsifier concentration is the most important factor controlling the EFF followed by the theoretical drug loading. In addition, a maximum drug loading and minimum stabilizer concentration should be used for a significantly maximum EFF. Actual drug loading percentage within the 12 PB formulations could be assessed rapidly and non-invasively using both NIR and NIR imaging approaches. Relative reflectance intensities of hyperspectral images were useful in discriminating the 12 formulations based on their CyA content. It combines the capability of spectroscopy for molecular analysis with the power of visualization affording precise characterization of the chemical composition and domain structure of PLGA nanoparticles.
Acknowledgments
The authors would like to thank the Oak Ridge Institute for Science and Education (ORISE) for its support with a research postdoctoral fellowship. The views presented in this article do not necessarily reflect those of the US Food and Drug Administration. The authors also extend this acknowledgment to Dr. Katherine Tyner and Dr. Christopher Ellison for helping to capture the SEM images and NIR images, respectively.
References
- 1.Italia JL, Bhatt DK, Bhardwaj V, Tikoo K, Ravi Kumar MNV. PLGA nanoparticles for oral delivery of cyclosporine: Nephrotoxicity and pharmacokinetic studies in comparison to Sandimmune Neoral. J Control Release. 2007;119:197–206. doi: 10.1016/j.jconrel.2007.02.004. [DOI] [PubMed] [Google Scholar]
- 2.Hebert MF. Contributions of hepatic and intestinal metabolism and P-glycoprotein to cyclosporin and tacrolimus oral drug delivery. Adv Drug Deliv Rev. 1997;27:201–214. doi: 10.1016/s0169-409x(97)00043-4. [DOI] [PubMed] [Google Scholar]
- 3.Nutan MTH, Vaithiyalingam SR, Khan MA. Controlled release multiparticulate beads coated with starch acetate: Material characterization, and identification of critical formulation and process variables. Pharm Dev Technol. 2007;12:307–320. doi: 10.1080/10837450701247483. [DOI] [PubMed] [Google Scholar]
- 4.Guidance for Industry. PAT—A framework for innovative pharmaceutical development, manufacturing, and quality assurance. US Department of Health and Human Services, FDA/CDER/CVM/ORA/CGMPs. 2004 Available online at: http://www.fda.gov/cder/guidance/6419fnl.pdf.
- 5.Blanco M, Villarroya I. NIR spectroscopy: A rapid-response analytical tool. Trends Anal Chem. 2002;21:240–250. [Google Scholar]
- 6.Zidan SA, Sammour OA, Hammad MA, Megrab NA, Habib MJ, Khan MA. Process analytical technology: Non-destructive assessment of anastrozole entrapment within PLGA microparticles by near infrared spectroscopy and chemical imaging. J Microencapsul. 2008;25:145–153. doi: 10.1080/02652040601034963. [DOI] [PubMed] [Google Scholar]
- 7.Koehler FW, Lee E, Kidder LH, Lewis EN. Near infrared spectroscopy: The practical chemical imaging solution. Spectros Europe. 2002;14:12–19. [Google Scholar]
- 8.El-Malah Y, Nazzal S. Hydrophilic matrices: Application of Placket–Burman screening design to model the effect of POLYOX–carbopol blends on drug release. Int J Pharm. 2006;309:163–170. doi: 10.1016/j.ijpharm.2005.11.032. [DOI] [PubMed] [Google Scholar]
- 9.Cirovic DA. Influence of mixture design on multivariate prediction of PAHs in mixture spectra. Talanta. 1998;45:989–1000. doi: 10.1016/s0039-9140(97)00205-1. [DOI] [PubMed] [Google Scholar]
- 10.Mok H, Park TG. Direct plasmid DNA encapsulation within PLGA nanospheres by single oil-in-water emulsion method. Eur J Pharm Biopharm. 2008;68:105–111. doi: 10.1016/j.ejpb.2007.04.022. [DOI] [PubMed] [Google Scholar]
- 11.Cho S, Chung H, Lee Y. Simple and fast near-infrared spectroscopic analysis of hydroxyl number of polyol using a disposable glass vial. Microchem J. 2005;80:189–193. [Google Scholar]
- 12.Savitzky A, Golay MJE. Smoothing and differentiation of data by simplified least squares procedures. Anal Chem. 1964;36:1627–1639. [Google Scholar]
- 13.Chorny M, Fishbein I, Danenberg HD, Golomb G. Lipophilic drug loaded nanospheres prepared by nanoprecipitation: Effect of formulating variables on size, drug recovery and release kinetics. J Control Release. 2002;83:389–400. doi: 10.1016/s0168-3659(02)00211-0. [DOI] [PubMed] [Google Scholar]
- 14.Quintanar-Guerrero D, Fessi H, Allémann E, Doelker E. Influence of stabilizing agents and preparatives variables on the formation of poly(D,L-lactic acid) nanoparticles by an emulsification-diffusion technique. Int J Pharm. 1996;143:133–141. [Google Scholar]
- 15.Sandor M, Enscore D, Weston P, Mathiowitz E. Effect of protein molecular weight on release from micron-sized PLGA microspheres. J Control Release. 2001;76:297–311. doi: 10.1016/s0168-3659(01)00446-1. [DOI] [PubMed] [Google Scholar]
- 16.Schwendeman SP, Gupta RK, Siber GR, Langer R. Pathways of inactivation of tetanus toxoid in the presence of PLA2000. Presentation at the AAPS meeting; Miami Beach, Florida, USA. 1995. p. S-80. abstract reprinted in Pharm Res. [Google Scholar]
- 17.Vert M, Coudane J, Ustariz C, Schwach G. Bioresorbable polymer microspheres free from surface active agents, their preparation and application as drug. International Publication WO 93/25191. 1993 December 23 [Google Scholar]
- 18.Carrio A, Schwach G, Coudane J, Vert M. Preparation and degradation of surfactant-free PLGA microspheres. J Control Release. 1995;37:113–121. [Google Scholar]
- 19.Liggins RT, Burt HM. Paclitaxel loaded poly(l-lactic acid) microspheres: Properties of microspheres made with low molecular weight polymers. Int J Pharm. 2001;222:19–33. doi: 10.1016/s0378-5173(01)00690-1. [DOI] [PubMed] [Google Scholar]
- 20.Zidan AS, Sammour OA, Hammad MA, Megrab NA, Hussain MD, Khan MA, Habib MJ. Formulation of anastrozole microparticles as biodegradable anticancer drug carriers. AAPS PharmSciTech. 2006;7:61–69. doi: 10.1208/pt070361. [DOI] [PMC free article] [PubMed] [Google Scholar]
- 21.Italia JL, Bhardwaj V, Kumar MNVR. Disease, destination, dose and delivery aspects of ciclosporin: The state of the art. Drug Discov Today. 2006;11:846–854. doi: 10.1016/j.drudis.2006.07.015. [DOI] [PubMed] [Google Scholar]
- 22.Heigl N, Petter CH, Lieb M, Bonn GK, Huck CW. Near-infrared reflection spectroscopy and partial least squares regression for determining the total carbon coverage of silica packings for liquid chromatography. Vibrational Spectrosc. 2009;49:155–161. [Google Scholar]
- 23.Smith RC, Baker KS. Optical properties of the clearest natural waters (200–800 nm) Appl Opt. 1981;20:177–184. doi: 10.1364/AO.20.000177. [DOI] [PubMed] [Google Scholar]
- 24.Shenk J, Workman S, Westerhaus JJ. Application of NIR spectroscopy to agricultural products. In: Burns DA, Ciurczak EW, editors. Handbook of near infrared-analysis. New York: Marcel Dekker; 1992. pp. 383–431. [Google Scholar]
- 25.Otsuka M. Comparative particle size determination of phenacetin bulk powder by using Kubelka–Munk theory and principal component regression analysis based on near-infrared spectroscopy. Powder Technol. 2004;141:244–250. [Google Scholar]


