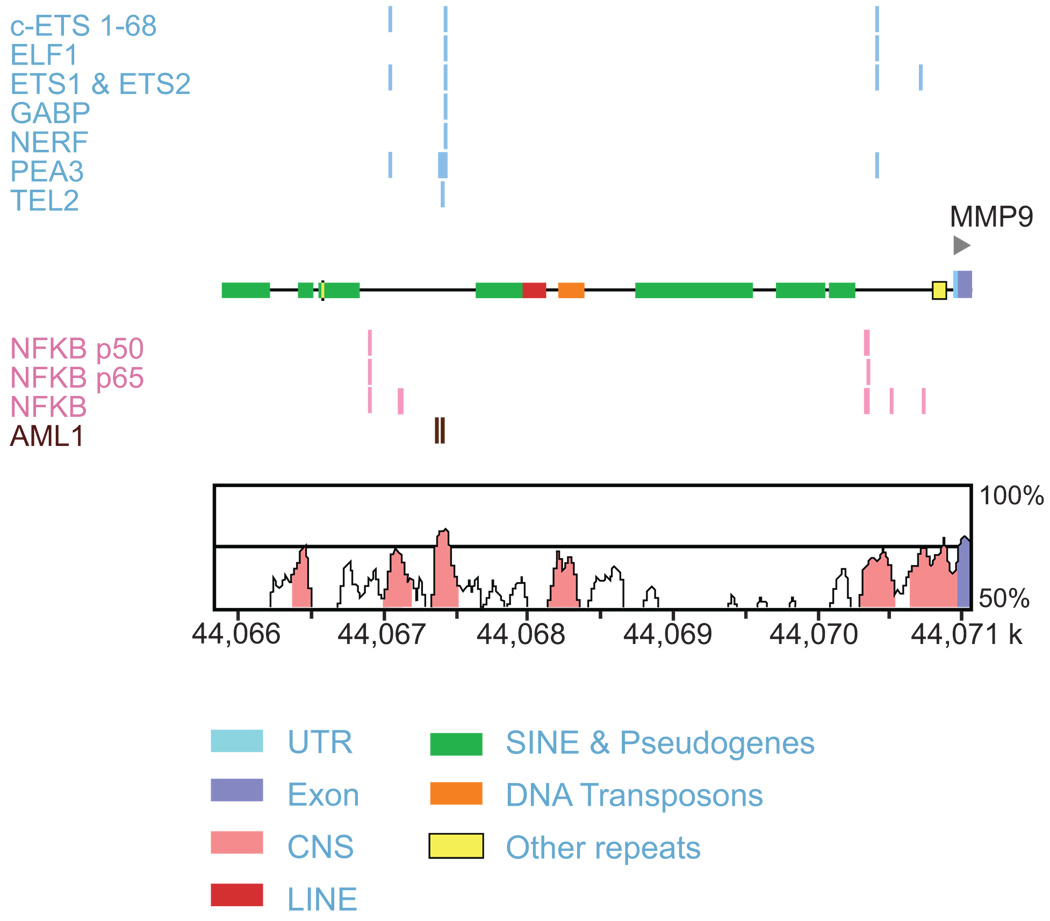
Figure 3.
Schematic of the 5 kb promoter region in MMP9. Upper portion of the figure shows conserved, aligned binding sites in the 5 kb promoter region of MMP9 for the enriched TFBSs in the upregulated gene set analysis. In the lower portion of the figure the y-axis demonstrates the conservation (%) between mouse and human, and the x-axis represents the location on the human chromosome. The genomic sequence is in kilobase pairs (k). Conserved regions above the level of 70%/100 bp are highlighted under the curve, with pink indicating a conserved noncoding region; and blue, a conserved exon. 43 UTR, untranslated region; CNS, conserved non-coding sequence; LINE, long interspersed nuclear element; SINE, short interspersed nuclear element. Figure modified from Whole Genome rVISTA output.43

