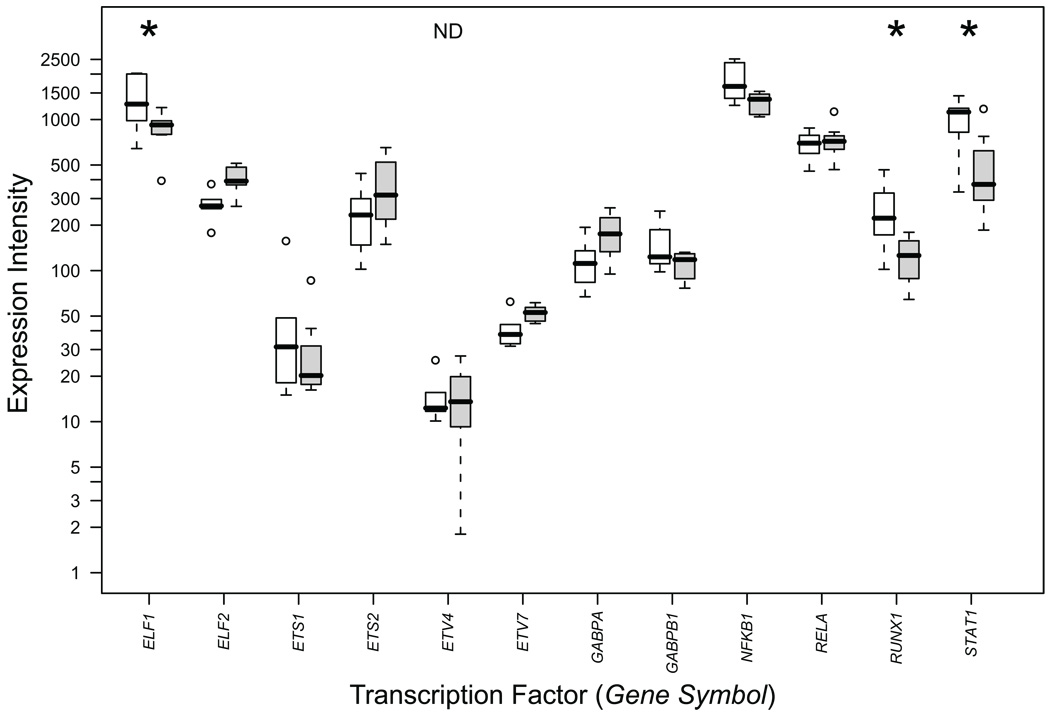
Figure 5.
Box and whisker plots of mRNA levels for transcription factors with statistically overrepresented binding sites in the promoters of the upregulated gene set. Results are based on microarray expression profiling which have been described previously.5 RNA expression levels in signal intensity units are indicated on the ordinate-axis in logarithmic scale. Open boxes represent AAA patients (n = 7) and shaded boxes represent abdominal aorta samples from non-aneurysmal autopsy samples (n = 7). Thick horizontal bars in the boxes indicate median values, boxes indicate interquartile range, whiskers indicate range of non-outlier values, circles indicate outliers less than 3 interquartile range units. Gene symbols available from the National Center for Biotechnology Information (NCBI; http://www.ncbi.nlm.nih.gov/) were used. Asterisks indicate statistically significant results after FDR correction. ND, not detected, indicates that PEA3 (ETV4) was scored as not expressed since the signals were not statistically different from background noise at the 99% confidence level. For numerical values of the expression data, see Table S6.

