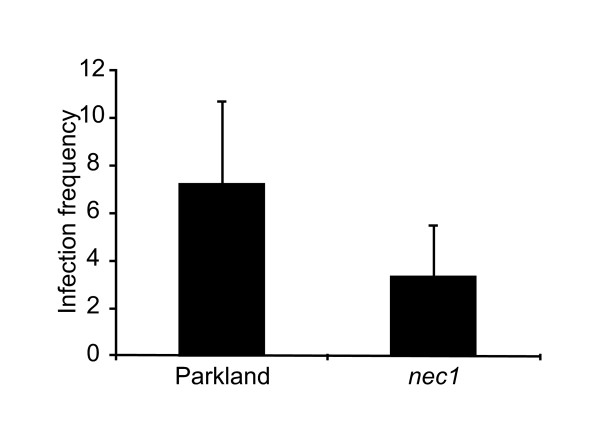
Figure 4.
Bgh microcolony formation on nec1 and wt plants. Excised segments of barley leafs were inoculated with a virulent Bgh isolate. Microcolony formation was inspected microscopically 4 days post infection and infection rate was expressed as a number of microcolonies per cm-2 leaf area. Figure reflects data from two independent experiments. Error bars represent standard deviation. Infection frequency significantly differs between nec1 and Parkland (p < 0.001, t-test).

