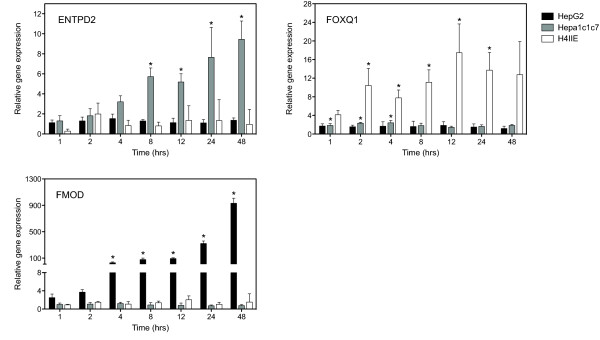
Figure 6.
QRTPCR verification of examples of species-specific orthologous gene expression responses identified from whole-genome microarray analysis at 24 hrs in the human HepG2, mouse Hepa1c1c7 and rat H4IIE cell lines. The same RNA used for microarray analysis was examined by QRTPCR. Representative orthologs that exhibited significant expression in only one species were verified; FMOD, ENTPD2 and FOXQ1 and were differentially expressed in only the HepG2, Hepa1c1c7 and H4IIE cells respectively. Fold changes were calculated relative to time-matched vehicle controls. Error bars represent the standard error of measurement for the average fold change and the asterisk (*) indicates p < 0.05.

