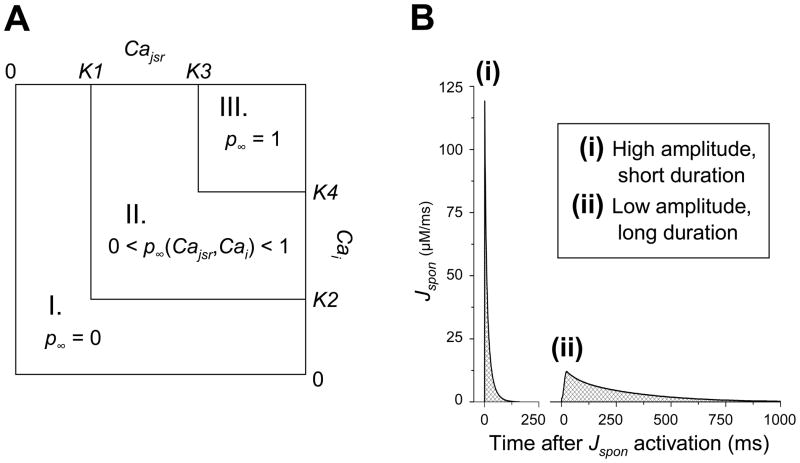
Fig. 1.
Spontaneous release (Jspon) formulation. (A) Calculation of p∞, the steady state of the Jspon gate variable p, as a function of Cajsr and Cai. In region I (Cajsr < K1 or Cai < K2), p∞ = 0. In region II (Cajsr > K1, Cai > K2, and either Cajsr < K3 or Cai < K4), p∞ is a linear function of Cajsr and Cai. In region III (Cajsr > K3 and Cai > K4), p∞ = 1. (B) Sample traces of Jspon activations (elicited via high-frequency stimulation) for two different sets of Jspon parameter values. One set (ii) yields low amplitude, long duration Jspon events. The other set (i) yields high amplitude (via reduction of K3-K1 and K4-K2), short duration (via reduction of τp) Jspon events. The total Ca released from the SR (crosshatched region) is relatively equal for both morphologies.

