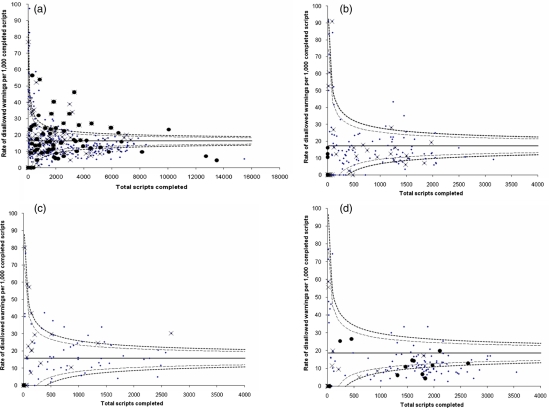
Figure 1.
Funnel plots of rates of high-level (hard stop) alerts against number of prescriptions. Rates of high-level (hard stop) alerts per 1000 completed prescriptions with mean (solid line) and 95 (dashed lines) and 99 (dotted lines) percent confidence bands. Doctors whose rate of intermediate (password) alerts exceeds the corresponding 95% confidence band are marked with ‘x’ and doctors whose rate of low-level (tickbox) alerts exceeds the 95% confidence band are marked with a solid dot. a. All Directorates. b. General Surgery Directorate. c. Trauma/Orthopaedic Directorate. d. General Medicine Directorate

