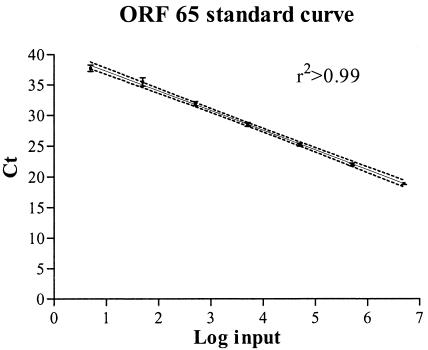
FIG. 1.
Standard curve for TaqMan PCR. Serial dilution of the HHV-8 plasmid ranging from 5 to 5 × 10⁶ copies input. The error bars show the standard deviation of the Ct values. The solid line was obtained by linear regression analysis (r2 > 0.99; P < 0.001). The dotted line represents the 95% confidence interval for the regression.

