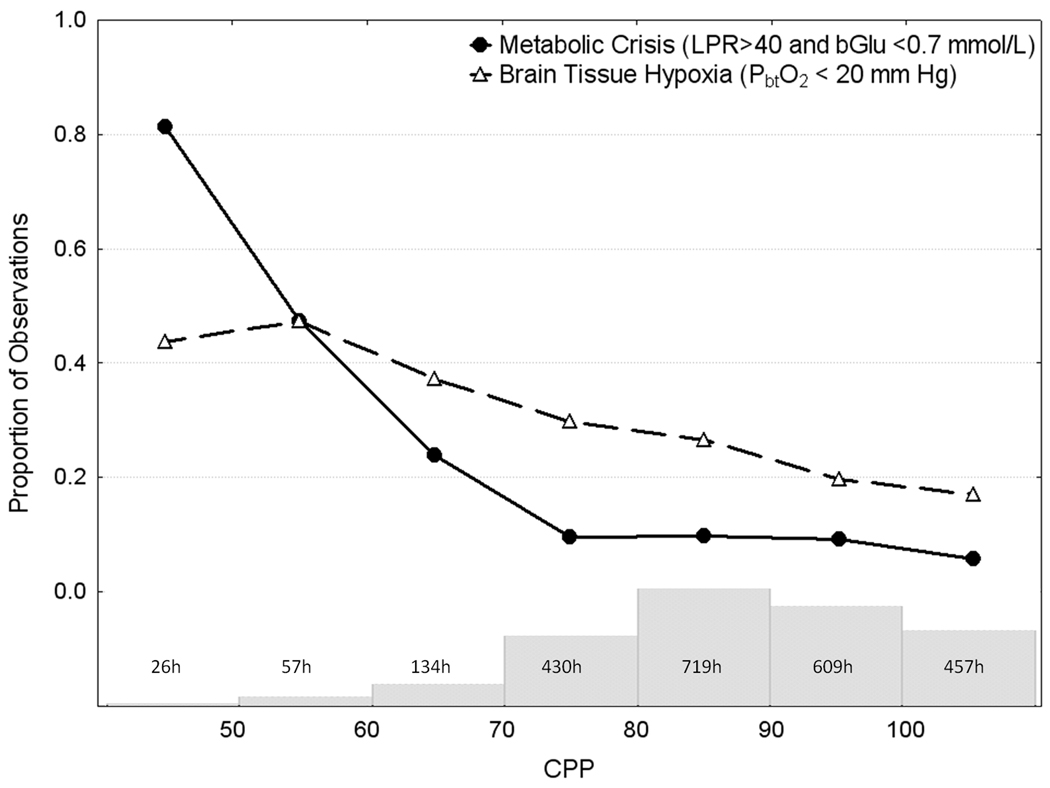
Figure 1.
Depicts observed probability of cerebral metabolic crisis and brain tissue hypoxia over the range of spontaneous cerebral perfusion pressures (CPP). The labeled histogram is the number of patients hours spent in each 10 mm Hg range of CPP. See Table 3 for the results of a multivariable model (GEE) that correspond to this figure.

