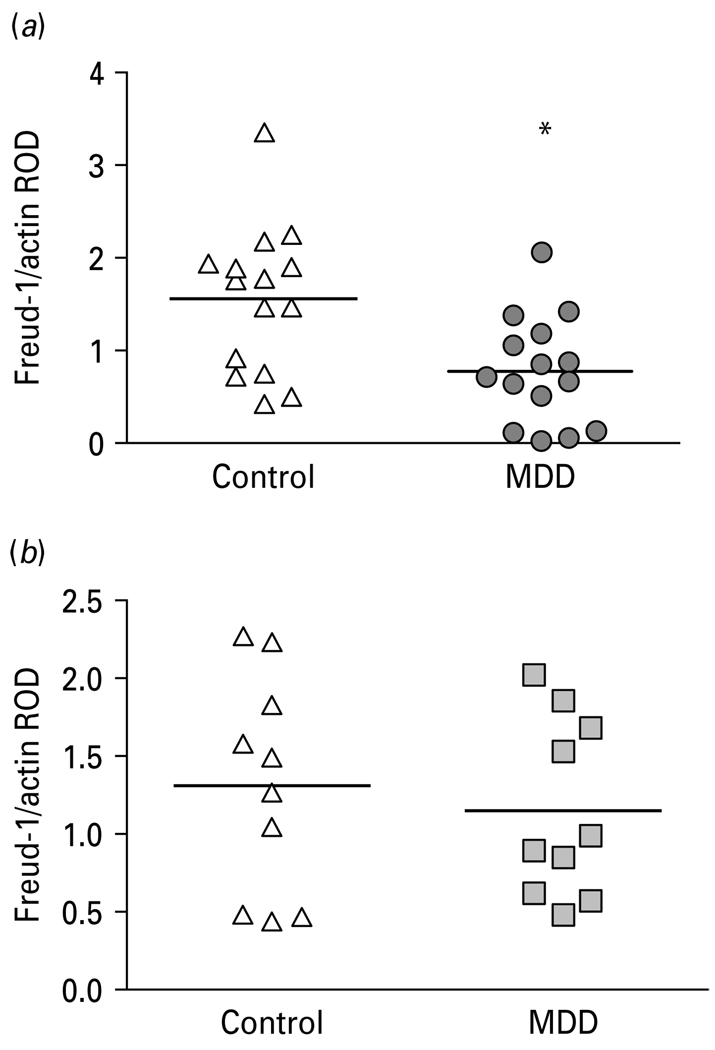
Fig. 5.
(a) Scatterplot of Freud-1 protein levels normalized to actin relative optical density (ROD) in prefrontal cortex (PFC) of younger (<58 yr) controls and major depressive disorder (MDD) subjects. (b) Scatterplot of Freud-1 protein levels normalized to actin ROD in PFC of older (≥58 yr) control and MDD subjects. Data were analysed using a maximum-likelihood mixed-models test. Younger subject groups: control subjects (1.56 ± 0.20, mean ± S.E.M.) compared to the matched MDD subjects (0.78 ± 0.15; age <58 yr; t21=2.84, * p=0.010). Older subject groups: control subjects (1.32 ± 0.22) compared to matched MDD subjects (1.15 ± 0.18; age ≥58 yr; t21=0.53, p=0.602).

