
Figure 4.
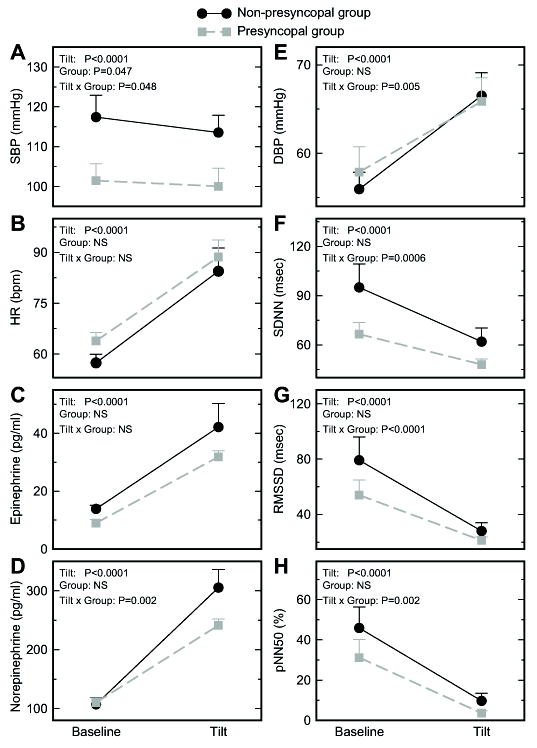
Physiological responses to head-up tilt, and their differences between the non-presyncopal (circles) and the presyncopal (squares) groups. Data are presented as Mean±SE. Shown are P values for tilt effects, mean group differences, and the interaction between group and tilt stressor. Results were obtained from the mixed model ANOVAs (Supplemental Table II). Here “NS” indicates P >0.1.