
Figure 5.
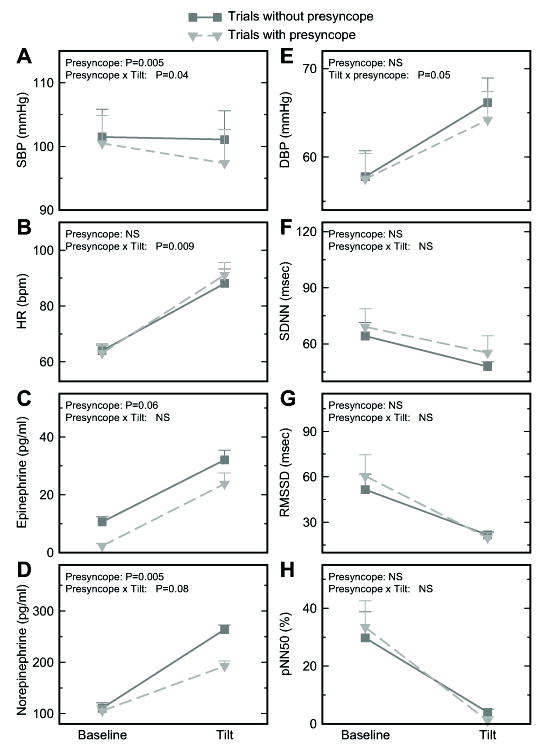
Physiological responses to head-up tilt, and their differences between 51 completed trials (squares) and 21 aborted trials (triangles) within the presyncopal group. Data are presented as Mean±SE, where Mean was obtained by averaging the individual means for presyncopal trials and non-presyncopal trials separately and SE indicates between-subject error. Shown are P values for the effects of presyncope and its interaction with tilt effect. Results were obtained from the mixed model ANOVAs (Supplemental Table III). Here “NS” indicates P >0.1.