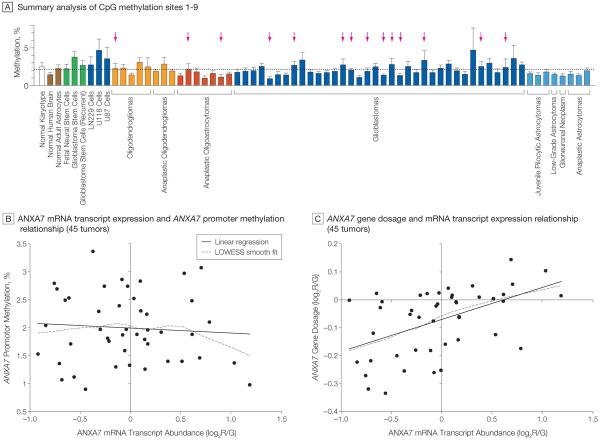
Figure 4. ANXA7 Promoter Methylation Analysis and ANXA7 Promoter-Gene–mRNA Transcript Relationship.
A, Pyrosequencing was used to assess the methylation percentage of 9 CpG sites close to the transcriptional start site within the annexin A7 (ANXA7) promoter in 59 human gliomas from Stanford University and various control cells. Bars indicate the overall promoter methylation profile per sample by averaging the methylation profiles of all 9 CpG sites; error bars indicate SD. Horizontal dotted line denotes the average methylation percentage across all samples. Tumors showing deletion of the ANXA7 gene indicated by arrows. Bar colors denote histological subtypes of gliomas. Dark blue coloration of bars for LN229, U118, and U87 cells indicates their origin from glioblastoma tumors. Green bars denote cells with stem cell–like phenotype; brown bars, normal brain tissue and normal brain cells. B, Linear regression of ANXA7 mRNA expression on ANXA7 promoter methylation in 45 of the 59 Stanford University tumors profiled in panel A; availability of corresponding ANXA7 gene expression data reveals no significant relationship (P=.627). The mRNA transcript expression values indicate the log2 ratio of red-to-green fluorescence dye intensity (log2R/G) and are normalized to the median ANXA7 gene expression of all tumors. Locally weighted least squares (LOWESS) smooth fit confirmed the appropriateness of a linear regression analysis. C, Similar linear regression of mRNA transcript expression on gene dosage in the same 45 tumors confirms a significant gene–mRNA transcript relationship for ANXA7 (P=.0005). Gene dosage values are expressed as log2R/G ratios estimated by the circular binary segmentation algorithm. Negative gene dosage indicates lower gene dosage compared with that observed for the majority of the samples, ie, lower gene dosage compared with a normal diploid state.

