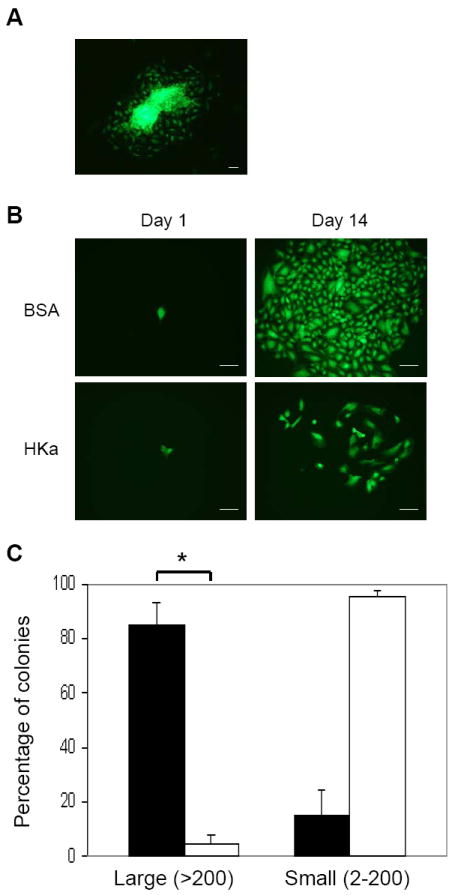
Figure 1. HKa inhibits the colony-forming capacity of EPC colonies on collagen surfaces.

(A) Fluorescent microscopic image of single colony expansion of initial EPCs expressing EGFP. (B) Colony forming assay. On day 1, single cell suspension was seeded on a collagen-coated plate, and cultured in the presence of 0.1% BSA or 50 nM HKa for 14 days. Representative photomicrographs of different endothelial cell clusters (2 - 200 cells) or colonies (more than 200 cells) derived from a single EPC. Scale bar represents 50 μm. (C) The percentage of single EPC-derived colonies undergoing at least 1 cell division after 14 days of culture. Large: colonies of more than 200 cells; Small: colonies of 2-200 cells. ■, BSA, □, HKa. Data represent the results of 3 independent experiments. *P < 0.001.
