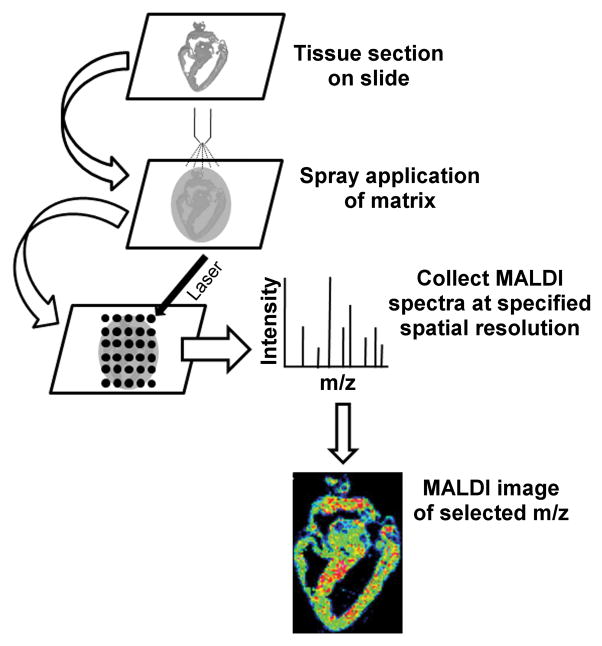
Figure 1. Workflow for MALDI Imaging Experiment.
Tissue sections are mounted on MALDI target and matrix is applied by spray coating. MALDI mass spectra are acquired at a specified spatial resolution (75–100 μm in the present study). Plots of spectral intensity and location for a specified m/z value produce a MALDI image.

