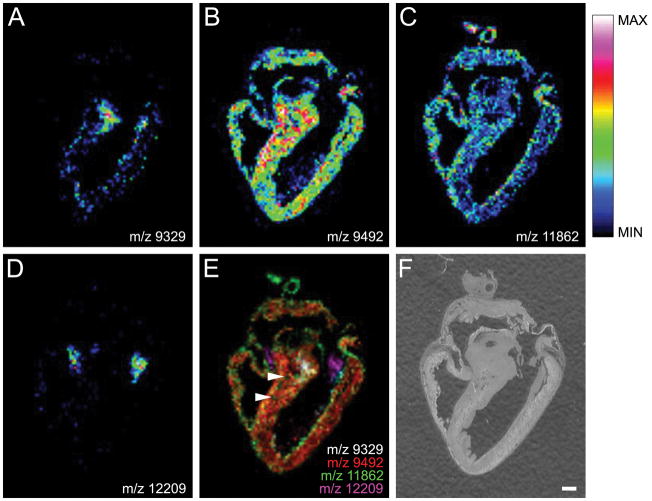
Figure 4. Chick Heart Imaging Mass Spectrometry with CHCA matrix.
(A) The protein signal at m/z 9329 is localized to the bundle of His. (B) The protein signal at m/z 9492 shows an even distribution throughout the myocardium. (C) The protein signal at m/z 11862, while expressed in the myocardium, is also localized to the walls of the major vessels of the heart. (D) A signal at m/z 12209 was localized to valve structures. (E) An overlay image of protein signals at m/z 9329 (white), m/z 9492 (red) m/z 11862 (green), and m/z 12209 (magenta) showing their spatial relationship to each other. The signal at m/z 11862 is also localized to coronary arteries (arrowheads). (F) The chick heart tissue section prior to application of matrix solution. Intensity scale applies to panels A–D. Scale bar = 1 mm.

