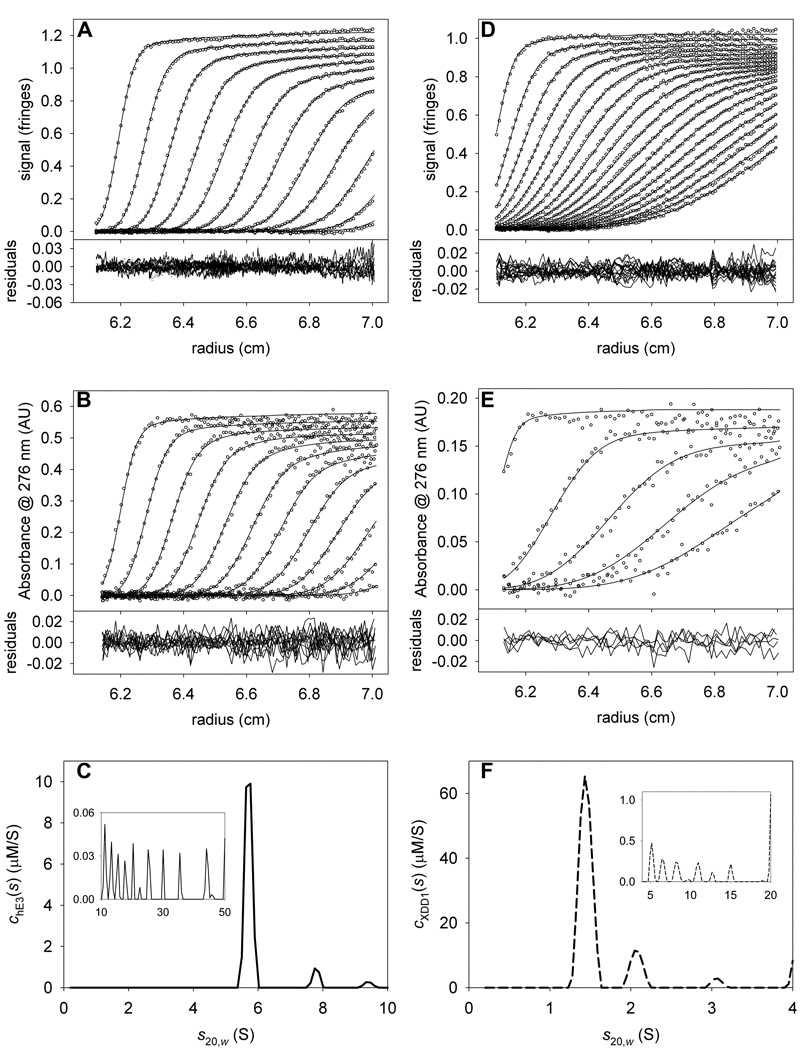
Figure 3. Data used to determine signal increments for hE3 and XDD1.
(A) IF data, fit, and residuals for hE3 alone. For this and all other IF data in this paper, only every 3rd scan and every 12th data point are shown. (B) A276 data, fit, and residuals for the same sample as in A. For this and all other absorbance data in this paper, only every 3rd scan and every 4th data point are shown, except where noted. (C) The chE3(s) distribution used to model the data in parts (A) and (B). The inset in this part shows the distribution used to model the aggregates. Note the change in scale for the y-axis. (D) IF data, fit, and residuals for XDD1 alone. (E) A276 data, fit, and residuals for the same sample as in C. Owing to the lower signal-to-noise ratio in this experiment, only every 6th scan is shown for the sake of clarity. (F) The cXDD1(s) distribution used to model the data in parts (D) and (E).

