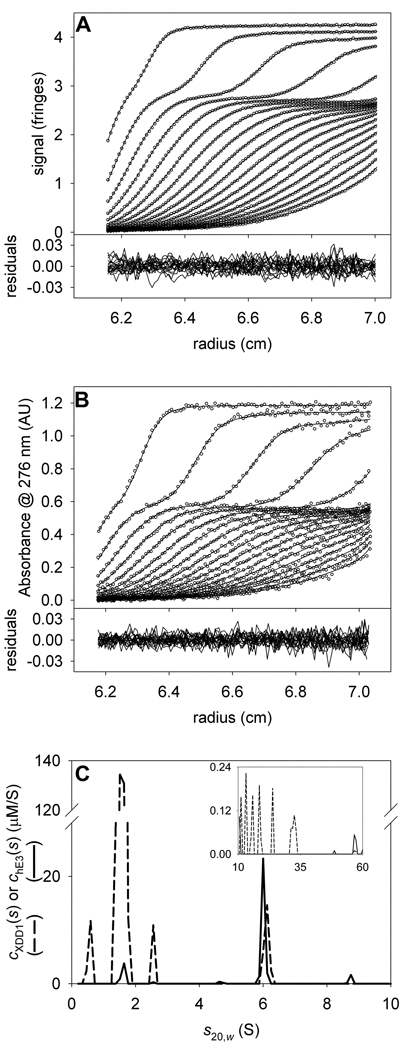
Figure 4. The stoichiometry of hE3 and XDD1.
(A) IF data, fit, and residuals for the mixture of XDD1 and hE3. (B) A276 data, fit, and residuals for the same sample as in A. (C) The chE3(s) and cXDD1(s) distributions used to model the data in parts (A) and (B). As in Figs. 3C and 3F, the chE3(s) distribution is represented by a solid line, while the cXDD1(s) distribution is shown with a dashed line. The inset in this part shows the distribution used to model the aggregates. Note the change in scale for the y-axis.

