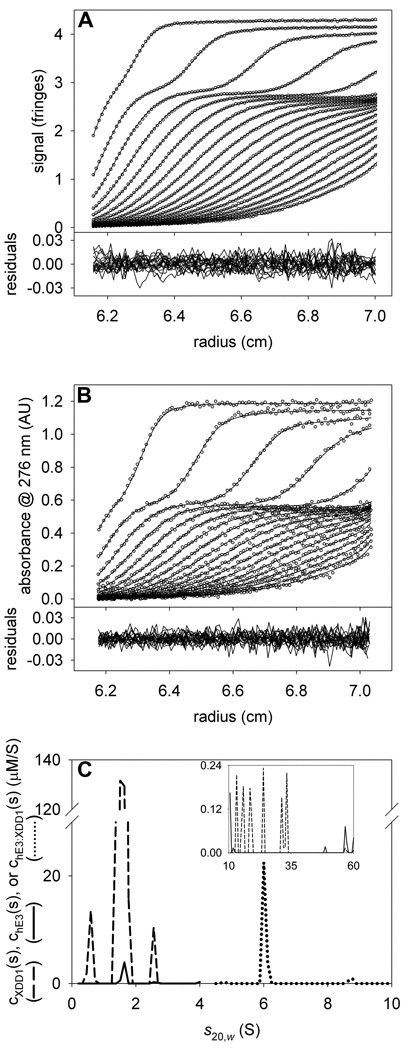
Figure 5. Analyzing the hE3/XDD1 mixture data with a fixed stoichiometry.
(A) IF data, fit, and residuals for the mixture of hE3 and XDD1. (B) A276 data, fit, and residuals for the same sample as in A. (C) The distributions used to model the data in parts A and B. At low and high (inset) s-values, chE3(s) and cXDD1(s) distributions were used. But in the range 4.5 to 10 S, a chE3:XDD1(s) distribution (dotted line) was modeled, with a fixed stoichiometry of 1:1.

