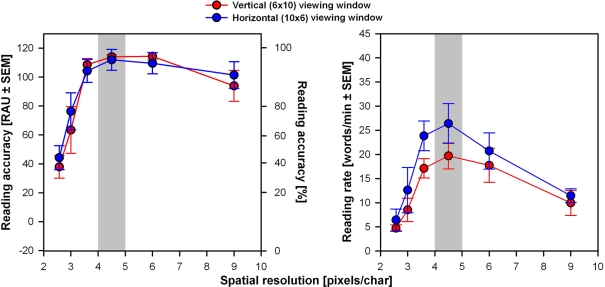
Figure 4.
Mean reading performance for all subjects versus spatial resolution (pixels/char). Results were calculated across all the three trials performed in each condition. The gray bars correspond to the optimum resolution range found in previous studies (Sommerhalder et al., 2003, 2004; Perez Fornos et al., 2005; Dagnelie et al., 2006). Left panel: Reading accuracy expressed in RAU ± SEM (left axes) and in % (right axes). Right panel: Reading rates (words/min) ± SEM.

