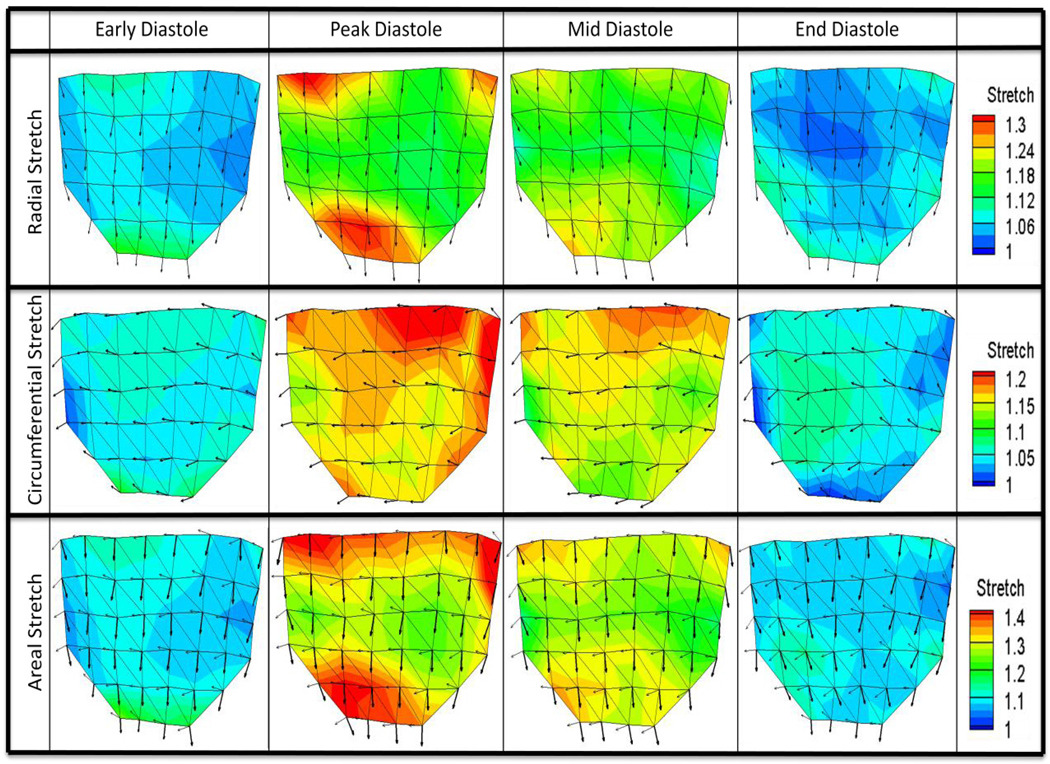
Figure 6. Surface Stretch Plots.
Stretch magnitudes as well as principle major and minor stretch vectors were calculated at 42 markers over the leaflet surface and averaged for n=6 valves to form one average data set. Plots here show regional variation of magnitude and direction of radial, circumferential, and areal stretch for four distinct time points: early diastole (beginning of loading phase), peak diastole (peak transvalvular pressure), mid diastole (middle time point of diastole), and late diastole (end of unloading phase). Radial stretch plots show principle major stretch vectors, circumferential stretch plots show principle minor stretch vectors, and areal stretch plots show both principle major stretch vectors (thick arrows) and principle minor stretch vectors (thin arrows).

