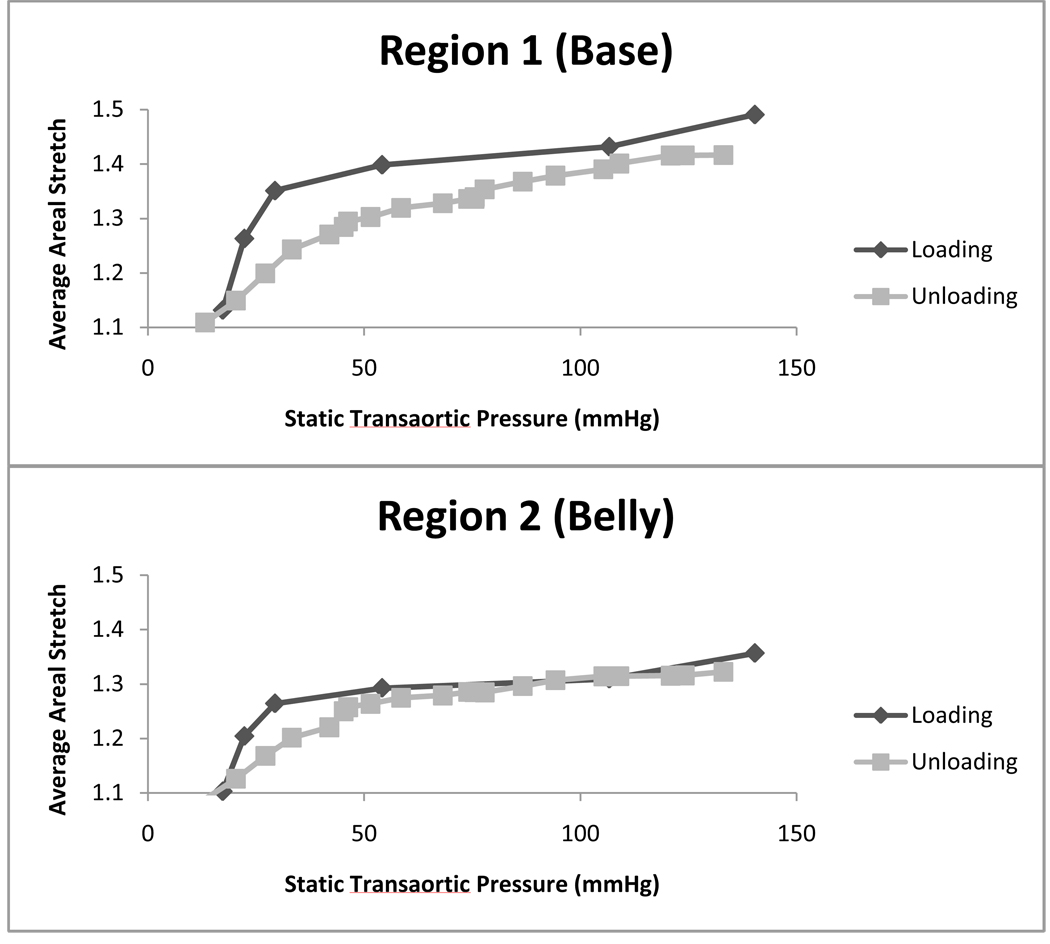
Figure 9. Average Areal Stretch vs. Static Transaortic Pressure.
Average areal stretch is plotted versus static transaortic pressure for regions R1 and R2. Stretch values are larger during loading than unloading for all transvalvular pressures in R1 and larger during loading than unloading for 18–55mmHg in R2. n=6.

