Figure 1.
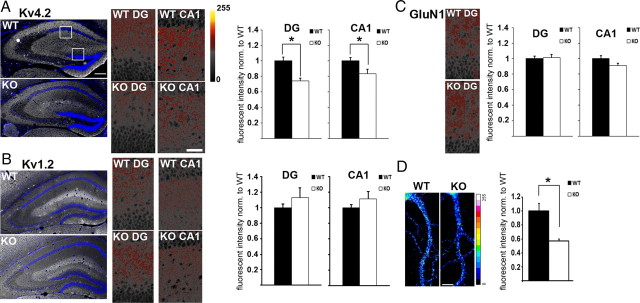
Kv4.2 protein levels are reduced in Fmr1 KO hippocampal dendrites. A–C, Quantitative analysis of fluorescent immunohistochemical stainings in dendritic layers from dentate gyrus (DG) and CA1 shows significantly reduced dendritic levels of Kv4.2 (A) (DG: nWT = 27, nKO = 25, *p = 0.001, Mann–Whitney U test; CA1: nWT = 27, nKO = 25, *p = 0.034, independent t test), whereas Kv1.2 (B) (DG: nWT = 21, nKO = 18, p = 0.547; CA1: nWT = 22, nKO = 22, p = 0.461, independent t tests), and GluN1 (C) (DG: nWT = 14, nKO = 14, p = 0.943; CA1: nWT = 16, nKO = 16, p = 0.394, independent t tests) are not significantly different. Example images of the entire hippocampus (including 4′,6-diamidino-2-phenylindole (DAPI) staining to visualize cell nuclei), the CA1 region, and the DG for Kv4.2 and Kv1.2 are shown on the left; for GluN1, example images from DG are shown. High-magnification images were pseudocolored with the intensity map shown in A. Scale bar, 200 μm. D, Quantitative immunofluorescence analysis in dendrites of 17 DIV cultured hippocampal neurons shows that Kv4.2 protein levels are significantly reduced in KO (n = 30, *p = 0.0007, independent t test). Immunofluorescent images were pseudocolored with a 16-color intensity map (shown on the right). Scale bar, 10 μm. All error bars represent SEM.

