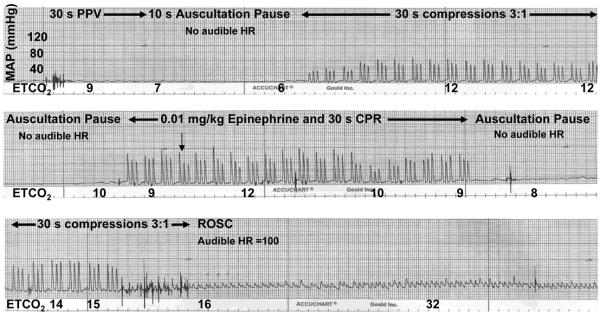
Figure 2. Representative tracing of ETCO2 and mean arterial pressure (MAP) during CPR.
Following initial positive pressure ventilation (PPV), ETCO2 values fell from asphyxia values to 6 mmHg and then gradually increased as blood pressure increased with initiation of CPR. ETCO2 values declined during each 10 second pause to auscultate for HR, reflecting loss of blood flow with interruption of cardiac compressions. After epinephrine administration, blood pressure improved and ETCO2 increased to 15 mmHg, at which point ROSC occurred and an audible HR was detected. The hatch marks along the bottom of each frame represent 1 sec.

