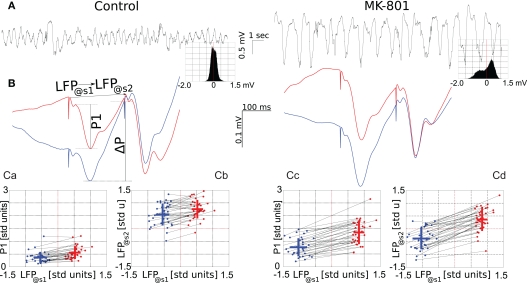
Figure 3.
Effect of systemic administration of MK-801 on LFP and different components of the evoked response. Left panels show measures in control condition, right panels after administration of MK-801 (0.05 mg/kg, i.v.). (A) Representative traces showing 20 s of ongoing LFP before (left) and after (right) MK-801 administration, insets show amplitude histograms of 600 s long epochs calculated in the two conditions. Note that not only the frequency and amplitude of the LFP oscillation changed after MK-801 administration, but the LFP tends to take positive values with higher probability. A pair of typical evoked field potentials are shown on (B), red curves are averages of evoked responses where the stimulation occurred at greater than or equal to 0 mV potential, while blue is where the LFP was less than 0 mV at the time of stimulation. (Ca,Cc) show dependence of the amplitude of the first component of the evoked response (P1) on the LFP value at the time of the first stimulation (LFP@s1). To compare data from different animals (n = 36) on the same plot, each raw LFP trace was transformed to zero mean, unity variation signal. Blue dots correspond to data derived from averaging 60 responses where LFP@s1 ≤ 0 mV, red where LFP@s1 > mV, black lines connect points from the same animal, blue and red crosses give mean (location), and SD (length) of data in both directions. (Cb,Cd) show dependence of the LFP voltage occurring at the time of the second stimulus (LFP@s2) on LFP@s1. For more details, see text.

