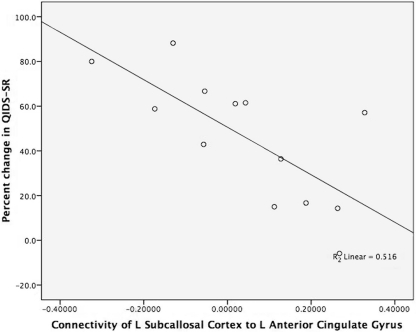
Figure 2.
Brain connectivity and antidepressant response. The figure displays the strong negative correlation between connectivity of the left subcallosal cortex to the left anterior cingulate gyrus and treatment outcome (percent change in QIDS-SR). The x-axis is the brain connectivity for the left subcallosal cortex (L_SC) to left anterior cingulate gyrus (L_ACG). The y-axis is the percent change in QIDS-SR score from baseline to 8 weeks of treatment (percent change in QIDS-SR). The two participants’ coordinates for L_SC to L ACG who took escitalopram are (−0.130, 88.2) and (0.188, 16.7). The participant's coordinates for L_SC to L_ACG who took aripiprazole are (0.019, 61.1).

