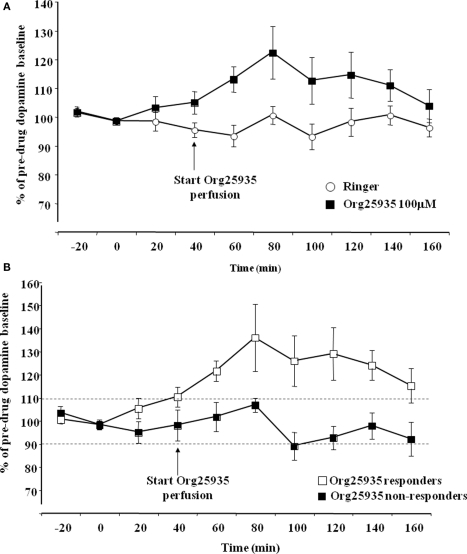
Figure 2.
(A) Accumbal dopamine levels as measured by in vivo microdialysis after perfusion of 100 μM Org25935 (n = 13) and Ringer (n = 8) into nAc, shown as means ± SEM. Drug perfusion started at time point 40 min as indicated by the arrow. Basal dopamine concentrations (mean ± SEM) for the Org25935 and vehicle group were 2.66 ± 0.66 and 2.02 ± 0.55 nM, respectively. For statistics: See Section “Results, Experiment 1.” (B) Accumbal dopamine levels as measured by in vivo microdialysis after perfusion of 100 μM Org25935 into nAc in the responding (n = 7) and non-responding (n = 6) subgroup, shown as means ± SEM. Drug perfusion started at time point 40 min as indicated by arrow. Basal dopamine concentrations (mean ± SEM) for responders and non-responders were 3.02 ± 1.24 and 2.37 ± 0.55 nM, respectively. For statistics: See Section “Results, Experiment 1.”

