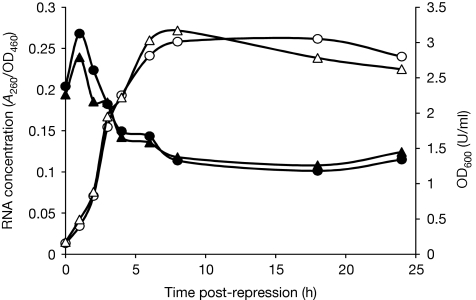
Figure 4.
The dynamics of RNA concentration in growing cells. Cells transformed with pBAD-t-ara were grown under inducing or non-inducing conditions until OD600 reached 0.2 U/ml, after which the cells were transferred to repressing media. At the designated time points, samples were collected, total RNA was extracted, cells were DNase I-treated and absorbance at 260 nm was measured. Optical densities of the cultures at each time point were measured at 460 and 600 nm. Zero time point denotes cultures immediately after transfer into glucose-containing media. Filled circles represent RNA concentrations from cells that were grown in arabinose-containing medium before shifting to glucose. Filled triangles represent RNA concentrations from cells that were grown without inductor before shifting to glucose. Open circles represent OD600 of the culture grown in the presence of arabinose before shifting to glucose. Open triangles represent OD600 of the culture grown without inductor before shifting to glucose. Experiments were repeated at least four times. A260, absorbance at 260 nm; ara, arabinose; OD460, optical density at 460 nm; OD600, optical density at 600 nm.

