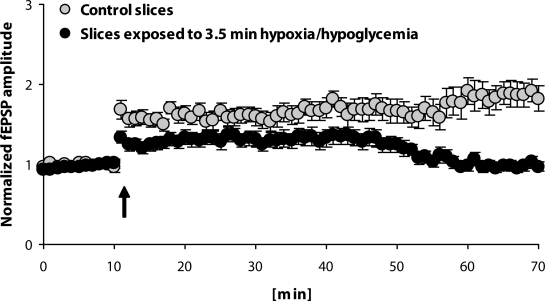
Figure 1.
LTP induced by a single burst (100 Hz, 1s) in CA3-CA1 pathway of control rat hippocampal slices (n=13) compared to the same response in slices (n=10) exposed to 3.5-min hypoxia/hypoglycemia and after 20 min to high-frequency stimulation. Arrow shows the application of HFS. Values express mean±SEM.

