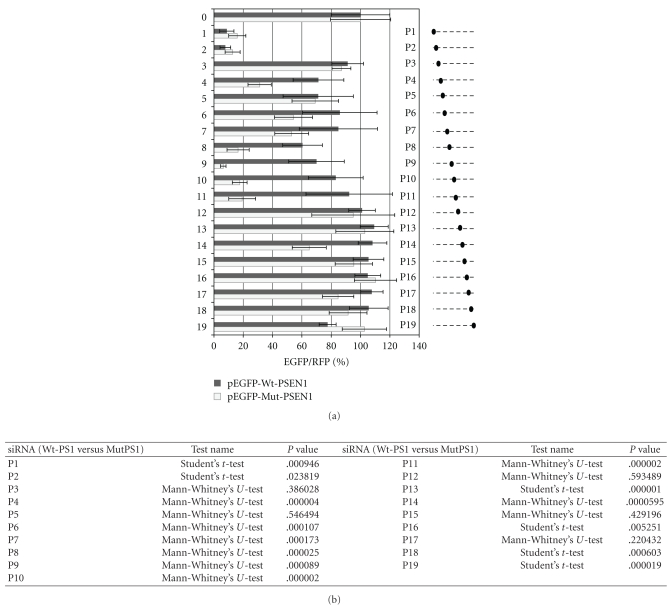
Figure 4.
(a) Comparison of the fluorescence level obtained from analysis of HeLa cells cotransfected with pEGFP-Wt-PSEN1(400) or pEGFP-Mut-PSEN1(400), pDsRRed-N1 and indicated siRNAs (0—control nonsilencing siRNA and siRNAs targeting the mutated form of PSEN1 transcript (denoted as P1–P19) (1 nM). Dotted lines at the right panel represent the antisense strands of the used siRNAs. Positions of the C:C mismatch between the guide strand of siRNA and the wild-type PSEN1 mRNA are indicated by the black dots. The level of the relative EGFP/RFP fluorescence of the cells transfected with control non-silencig siRNA was used as 100%. The results are mean values from three independent experiments. (b) Statistical analysis of differences between two groups of data (Wt-PSEN1 versus Mut-PSEN1) calculated by the use the Student's t-test (for data with normal distribution) or by the nonparametric Mann-Whitney's U-test. The differences with P < .05 were considered as statistically significant.

